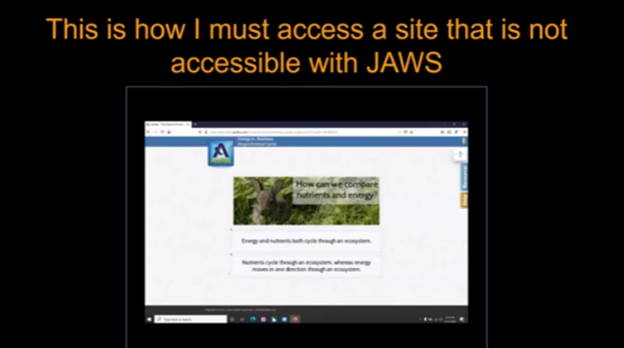
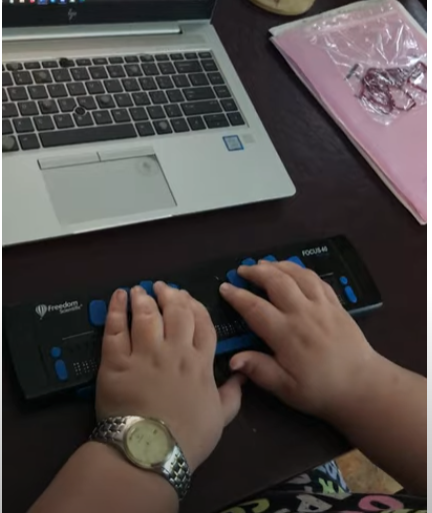
Using a Focus 40 Braille Display and JAWS, students can efficiently complete algebra assignments in Word, ensuring both speed and accuracy. They can navigate through documents, input mathematical symbols for their Algebra work, and graph equations using Desmos. The Braille Display provides tactile feedback while JAWS offers audio guidance, allowing students to efficiently edit, correct mistakes, and organize data into tables. With these tools, they can seamlessly complete algebraic tasks and submit their work via email, ensuring full participation in math activities.
To complete algebra problems in Word using a Focus 40 Braille Display and JAWS, students should follow these steps for effective Algebra with Focus Display:
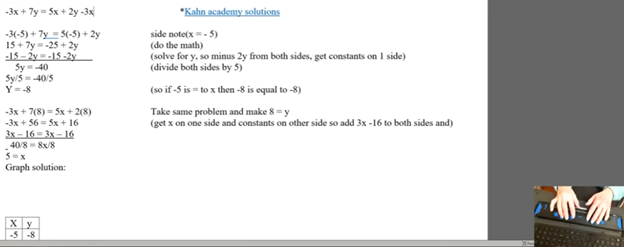
FOCUS and JAWS Display Commands
- Set the Braille Display to Input Mode: Begin by pressing G.7 + Space to switch through the display modes. Set it to Input Mode for algebra.
- Navigate the Document: Use 1 + Space to move to the top of the document. To navigate the document, students press the left-side buttons for backward movement. They then use the right-pan buttons to move forward, ensuring smooth progress while working on Algebra with the Focus Display.
- Enter Algebraic Symbols: Students can easily type algebraic symbols, like Delta (Δ), by using the keyboard. After typing, copy the symbol using Shift + C to avoid repeating it manually later.
- Work with Mathematical Formulas: To type formulas like “Rise over Run” (Δy/Δx), use the keyboard to input characters. Make sure to add spaces around operations for clarity, especially when sharing with sighted peers. For example, input the formula as “Δy = 2” and “Δx = 3” with a the Focus Display and JAWS.
- Navigate Through Graphing: To access graph, students can use the rocker bars or 1 + Space for upward navigation and 4 + Space for downward movement.
- Input Values into Desmos: After entering algebraic equations, students can switch to Desmos by pressing Shift + 4 + 5 (Alt + Tab equivalent). They can then input values and trace graphs using the Alt + T command for audio tracing.
- Copy and Paste Graphs: Once the graph is complete in Desmos, use Alt + Print Screen to capture the graph. Paste it into Word with Shift + V for documentation.
- Submit the Assignment: When the algebra problem is finished, the student can email the document by navigating to File using Alt + F and attaching it in Outlook. Then open Outlook, use F9 to quickly send the email once Outlook is open.
These steps help students efficiently solve algebra problems in Word while using their Braille Display for input. Additionally, students can smoothly navigate Desmos for graphing, enhancing their algebra skills with the Focus 40 Display
Enable Students to Efficiently complete Algebra with Focus Display
- Using Tables for Data: If the algebra assignment involves creating tables, students can use Alt + N to insert a table. On the Braille Display, press 6 + 8 + Space to activate the Alt command and navigate to the Table option. Once a table is created, pressing Tab will move between cells, and 4 + 5 + Space adds more rows as needed, making tables part of their Algebra workflow using a Focus Display.
- Auto-fitting Tables: To ensure tables fit content properly, use Alt + J + L to access the layout options. Select AutoFit Contents to adjust the table size automatically. This helps in organizing the data neatly for submission in Algebra with Focus Display assignments.
- Editing and Correcting Mistakes: If a student makes an error, they can use 3 + Space on the Braille Display to move by character and correct the mistake. Use Shift + 6 + 7 + Space to select the incorrect portion and retype it. The Braille Display’s tactile feedback helps ensure precision when editing formulas.
- Reviewing the Work: To review algebra problems, students can move back through the document using 1 + 4 + Space to navigate line by line. Press Insert + Up Arrow to have JAWS read back the current line, ensuring that everything is correct before submission.
- Final Submission Process: Once the assignment is complete, the student can go to Alt + F to access the File menu. Choose Share. From there, they can attach the document directly in an email. Using F9 forces Outlook to send the email quickly. Make sure their work is submitted on time, thereby completing their Algebra with Focus Display workflow.
More Lessons for Math
By following this step-by-step guide, students can efficiently complete algebra problems using the Focus 40 Braille Display, JAWS, and Word. The tactile feedback from the display, combined with JAWS’ audio guidance, enhances both speed and accuracy. This combination helps students solve math problems, graph equations, and organize data effectively. When using the Focus Display, students experience seamless transitions between tasks, ensuring smooth navigation throughout their algebra assignments.