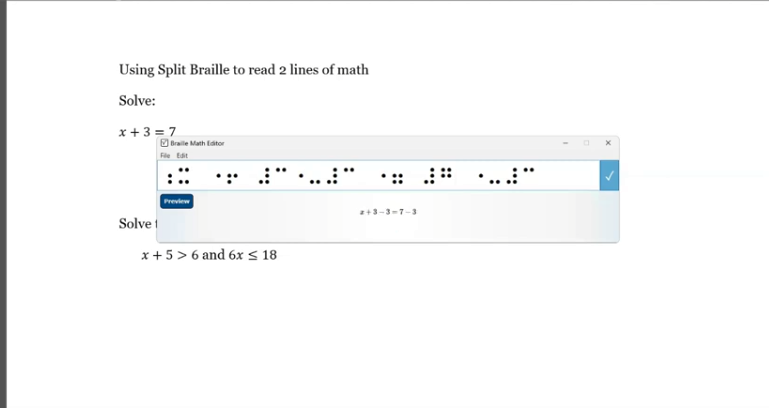
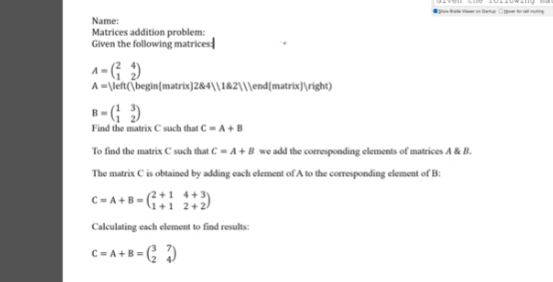
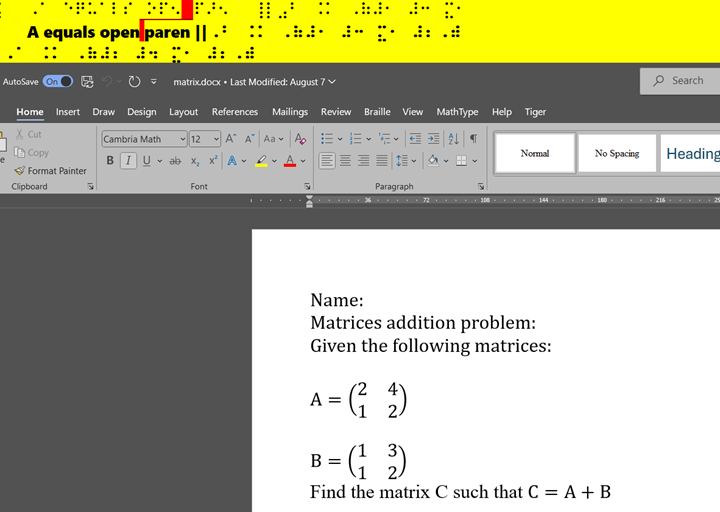
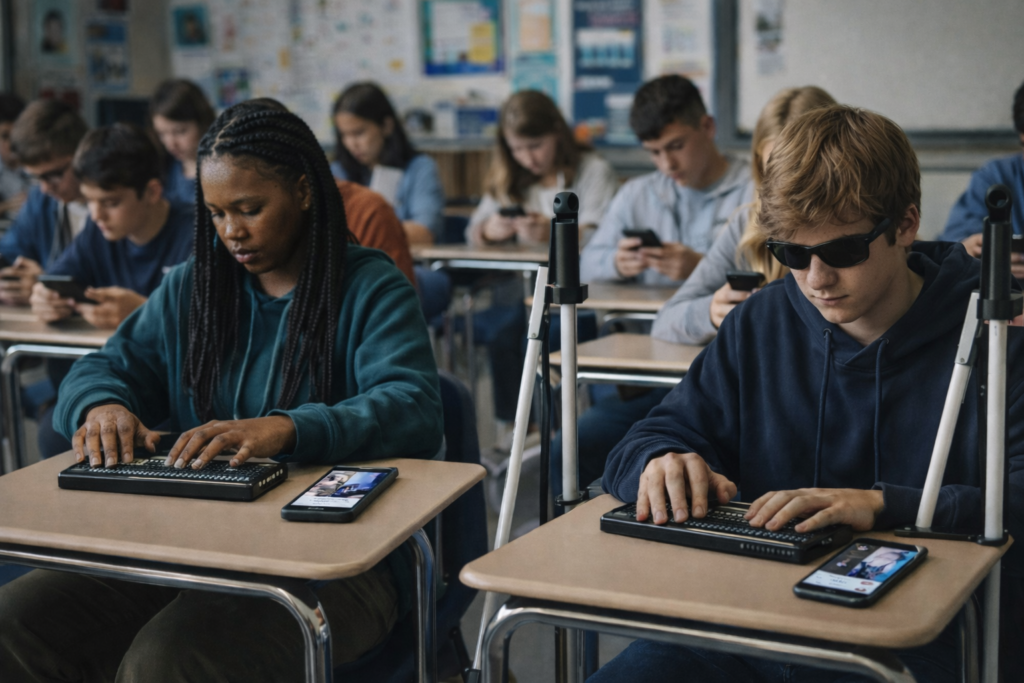
In this tutorial, Dr. Denise M. Robinson shows how to use JAWS with Braille Math and Word Math Editors. This video on UEB Math with JAWS empowers blind and visually impaired students and professionals. It provides tools and techniques to excel in mathematics. Set up WORD properly first, then continue.
UEB Math in Braille Math Editor
First, the tutorial introduces essential software and hardware. This includes JAWS, a Focus Braille Display, or NVDA and the necessary math editors. Dr. Robinson guides viewers through the setup process. She ensures all components are correctly configured for optimal performance.
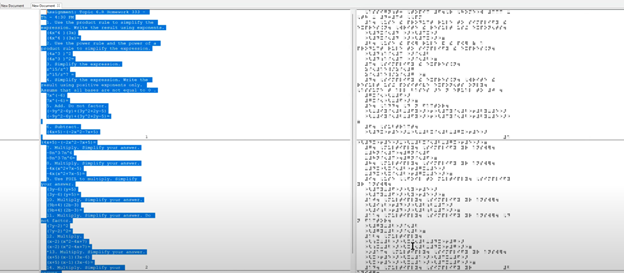
Next, the video explores the practical application of these tools. Viewers learn to input mathematical expressions using the Braille Math Editor. They navigate complex equations and use the split-braille-for-buffer mode to enhance workflow. Dr. Robinson offers clear, step-by-step instructions. This makes it easy for users to follow along and practice.
By the end of this tutorial, UEB math in braille math editor viewers understand how to use JAWS and Braille Math Editors efficiently. They can create, edit, and review UEB math content. This video is an invaluable resource. It helps enhance digital math literacy and achieve greater independence in academic or professional pursuits.
The new Split Braille™ for Buffer Mode in WORD for math is a feature in JAWS 2024. It offers powerful functionality for Braille display users. So, it allows viewing content from different locations on the same Braille line and a longer display is more advantageous to use. Complete Proper Word setup First, then continue.
Now let’s Enable Split Braille View-To enable a Split Braille view, press ALT+INSERT+V (or ALT+CAPS LOCK+V in Laptop layout) to open the Select Braille View dialog box. Focus Braille display users can press LEFT SHIFT+DOTS 1-2-7. In the dialog box, select your desired view and click OK. The active view remains for the current JAWS session and resets upon restarting JAWS.
Using Split Braille for Buffer Mode View in WORD for Math
By default, your current location appears in the left region, and the active view results appear in the right region. So, to swap these regions, reopen the Select Braille View dialog box and select the Swap split button mode. You can also change braille modes with a simple command
Navigating and Selecting Text
In most views, you can navigate and select text independently in the split region. Use the Right NAV rocker to pan and the Right Rocker bar to move by line. To select text for copying and pasting, press SHIFT button with a Cursor Router at the start and end of the selection. Dots 7 and 8 indicate the selection, which is automatically copied to the clipboard.
Commands for HumanWare Displays
For the Brailliant BI 40 series and Mantis Q40 displays:
Open Select Braille View dialog: Fourth Thumb Key+C1+C2+C3+C6 (or ALT+CAPS LOCK+V on Mantis Q40).
Toggle Buffered Text mode: C1+C2+C3 (not on Mantis Q40).
Pan split view region: Third and Fourth Thumb Keys.
Navigate by line: C6+Third and Fourth Thumb Keys (not on Mantis Q40).
Select text: First Thumb Key + Cursor Router.
For newer HumanWare displays:
Open Select Braille View dialog: K1 + pan Easy Access Bar right.
Swap regions: K1 + pan Easy Access Bar left.
Pan split view region: K4 + pan Easy Access Bar right/left.
Navigate by line: K4 + pan Easy Access Bar up/down.
Available Views
No Split View Mode: Uses the full display length for the current line (default).
Buffered Text: Captures text at your current location and displays it in the right half.
How to get a Job-Woman at PC with display and iPhone
Most jobs today use the same tools: a PC, a smartphone, and Windows workplace software. If students want a job later, they must learn these tools early. If anyone wants a job, you must master those tools with excellence. Character, consistency, loyalty, and trust — combined with strong tech skills — help people gain and keep lasting employment.
Blind and low-vision students need the same skills. They also need a screen reader, braille display, and tactile learning to access the world on equal terms.
This is why instruction cannot start late. It must start educationally at age three-as a baby from the womb just teaching parents how to help child.
Early learning builds kindergarten readiness. It keeps blind students even with their peers. Strong IEPs then protect continued teaching in tech, tactiles, and braille each year so they can keep pace with their peers.
When schools teach the right tools early, blind students enter the future ready to work, ready to compete, and ready to thrive.
Global Employment — All People
According to the International Labour Organization (ILO) and global labor data:
Employment Rate Worldwide
About 58% of people aged 15–64 are employed globally. (This includes full-time, part-time, formal and informal work.)
Another ~26% are outside the labor force (students, homemakers, retired)
~6–10% are officially unemployed (actively seeking work)
Key takeaway:Most people around the world have some form of work.
Technology Use at Work — General Global Trends
People use a mixture of technology on the job depending on industry, income level, and region.
Most tech adoption statistics come from large surveys, including:
International Telecommunication Union (ITU)
Statista digital economy surveys
World Bank ICT data
Global Workplace Analytics
These show broad patterns across sectors.
Computer Access at Work (Global Estimate)
About 70–75% of office workers worldwide use a computer at work. This includes laptops, desktops, and workstation terminals.
This varies by region:
High-income countries: ~85–90% computer use at work
Middle-income countries: ~60–75%
Low-income countries: ~30–50%
Smartphone Use at Work
Smartphones are extremely common globally, even where desktop PC penetration is lower.
Global estimates show:
85–90% of working adults use a smartphone at least daily for communication, email, scheduling, messaging, and business apps.
In many service, retail, field, and informal jobs, the smartphone is the primary computing tool.
PC vs. Mac vs. Other at Work (Global Split)
There is no exact global “one number,” but multiple tech market share sources give a snapshot of the device ecosystem used professionally:
PC / Windows
Estimated 75–80% of computers used in the workplace run Windows. This includes desktops, laptops, workstations, and enterprise systems.
Windows dominates business environments because:
Longstanding enterprise support
Broad software compatibility
Legacy systems in large organizations
Mac (macOS)
Estimated 15–20% of workplace computers.
Higher share in:
creative industries (design, media, publishing)
education and research institutions
startups and technology firms
some small business environments
Other (Linux, Chrome OS, Thin Clients)
5–10% combined share. These are more common in:
tech-savvy organizations
cloud-centric workplaces
specialized development environments
Technology People Use on the Job
Here is how technology breaks down by task:
Office / Knowledge Work
PC (Windows + Office)
Laptops, desktops
Email, Office suites, cloud apps
Collaboration tools (Slack, Teams, Zoom)
Data entry, spreadsheets
Creative / Design / Media
Mac systems are popular
Adobe Creative Suite
Video and audio editing tools
IT / Development
Split between Mac, PC, and Linux
Code editors (VS Code, Vim)
Cloud and DevOps tools
Data / Analysis
PCs for spreadsheets and databases
Macs for visualization and coding
Mobile-First Roles
Smartphones for:
communication (call, message)
scheduling
mobile apps (CRM, logistics)
Especially in:
retail
transportation
field service
Global Smartphone vs Computer at Work
Here’s a broad estimate:
Technology Type
Approx. Global Usage at Work
Smartphones
~85–90%
Desktop/Laptop Computers
~70–75%
Windows PCs
~75–80% of computer share
Macs
~15–20%
Other OS (Linux, Chrome OS)
~5–10%
Note: These percentages overlap — most people use both smartphones and computers.
WHY TECH ADOPTION LOOKS THIS WAY
Smartphones have high adoption because:
They are affordable
Widely available
Used for email, messaging, forms
Often required by employers for mobile work
PC (Windows) dominates because:
Enterprise software is built for it
IT infrastructure around Windows is mature
It’s cost-effective at scale
Mac is strong in:
Creative industries
Technology startups
Higher education
Design and media fields
SUMMARY — GLOBAL View
Employment: ~58% of adults globally are employed Smartphone use: ~85–90% use at work Computer use (general): ~70–75% use a PC/laptop Windows share: ~75–80% Mac share: ~15–20% Other OS: ~5–10%
Blind Teens See a World That Rarely Sees Them Back-They scroll social media with braille display and
The Silent Exhaustion Teens Carry Into the Classroom
The bell rang at 7:05 AM, but most of the class did not look up. At the front of the room, Ms. Sage watched them, really watched them and saw something most adults miss. In moments like this, it becomes clear why so many people are talking about Today’s Teens Feeling Overwhelmed. Twenty‑seven juniors sat in rows; faces washed in the cold glow of their screens. Their thumbs moved faster than their eyes. Notifications popped like fireworks. Someone laughed at a meme. Someone posted a photo… then deleted only minutes later because of fear someone judging the image.
Ms. Sage stood with sadness and concern.
The Hidden Weight Social Media Places on Today’s Teens
She had taught for thirty‑two years, but this generation was different. Not worse, just heavier. According to the latest national data, 57% of teen girls and 29% of teen boys now report persistent sadness or hopelessness, the highest levels ever recorded. And teens who spend more than three hours a day on social media which is nearly all of them, are twice as likely to experience symptoms of anxiety and depression.
She saw those numbers every day in their faces: tired, anxious, overwhelmed, disconnected, and fragile.
“Phones away,” she said gently. “All the way away.”
A few groaned. One boy rolled his eyes. But they obeyed.
On her desk sat a plain cardboard box. Nothing special. But today, it mattered.
“I want you to write down one thing,” she said, handing out slips of paper. “Not your name. Not a joke. Just the truth.
Then she turned to Suzy and John, her blind students. “You two can text me using SendAnonymousSMS,” she said. “I’ll copy your message onto a paper slip and drop it in the box with the others.” “That way no one will know who it’s from.”
She looked back at the room. “Everyone Write down the thought that runs through your mind — your heart — whenever you scroll your accounts. The one you never say out loud.”
The room stilled. Eyes wide.
When Comparison Becomes a Daily Battle for Teens
A cheerleader in the back, Lila, known for her perfect Instagram feed, stared at her blank paper under crushing pressure to “look” perfect. Her hands trembled. Just last week, she had confessed to the counselor that she spent over eight hours a day comparing herself to girls she did not even know, staying up late and scrolling into the early morning hours. And she was not alone. National surveys show that 46 percent of teens say social media makes them feel worse about their bodies and their families, and one in three teen girls say they feel “ugly” because of what they see online.
Every day, they scroll past smiling faces, perfect vacations, flawless skin, and filtered happiness and somewhere deep inside, they start believing everyone else is living a better life. They compare those highlight reels to their own quiet struggles and convince themselves they’re the only ones who feel sad, lonely, or left out.
Lila finally wrote something down and continued to move her pencil across the paper.
The Loneliness Behind the Laughs
Next to her, Jordan, the class clown tapped his pencil. He had 12,000 followers on TikTok. People loved him. But last month, he told a friend he felt “fake.” Research shows that teens who curate a “perfect” online persona are three times more likely to report loneliness, even when surrounded by people.
Jordan knew that feeling too well. He had one friend he could joke around with, someone he could confide in on the surface, but no one he trusted deeply. His parents had split two years ago, and his mom now worked two jobs just to keep the lights on. Most nights, he ate dinner alone while his sister stayed in her room, scrolling and picking at her food. They did homework alone. They fell asleep alone. The silence in the house made the loneliness louder, and the more he scrolled through everyone else’s “happy” lives, the more he believed he was the only one who felt this empty even though he saw the same despondent look on his sister’s face. So, he posted constantly, leaning into his class‑clown persona, trying to joke the loneliness away.
Blind Teens See a World That Rarely Sees Them Back
In the front of the room, Suzy and John knew what it felt like to be outsiders. Being blind set them apart before they even opened their mouths, and the feeling only sharpened when they scrolled through social media. With apps that read pictures aloud, the isolation deepened because no matter how many posts they explored, they rarely found people who were like them, lived like them, succeeded like them. They searched for blind mentors who could show them what was possible, yet they found few and sometimes none. Each empty search pressed the loneliness deeper. Students rarely talked with them because their blindness created a barrier built from difference and fear. Still, they kept scrolling, because that’s what teens did, even when it hurt.
Most of the class was not made up of kids like Lila, Jordan, or the school’s sports heroes. It was kids like Joe and Sue, the ones who sat in the back or middle rows, who blended in, who were never chosen first for anything. They weren’t popular, not even close, and they felt it every day. Students like Joe and Sue were the ones pushed aside in hallways, called hurtful names, talked over in group projects, laughed at for clothes their families could afford or hobbies no one else understood. They watched the popular kids climb the social ladder while they stayed invisible on the bottom rung, and the invisibility hurt almost as much as the teasing and social media scrolling. Being unseen didn’t protect them; it only made the loneliness sharper.
Brilliance and Secrets
Then, there were the two brilliant minds in the room: Jessica and James. The kind of students who competed at everything, from test scores to running for class president to who could finish the assignment first. They seemed happier than most, partly because they checked their social media feeds far less often than everyone else. They still used it — they were teens, after all — but they’d learned that too much scrolling made them feel worse, so they kept their distance when they could.
Even so, that choice, along with their drive, set them apart in a different way. They were the outliers, the only two who cared more about academics and future goals than trends or popularity. And because of that, some kids picked on them, calling them “perfectionists” or “teacher’s pets,” never understanding that Jessica and James weren’t trying to outshine anyone — they were just trying to build a future shaped by the dreams their parents had poured into them. That came with its own kind of pressure. When they fell short of what their parents expected, it hit their hearts harder than anything they could ever read online.
The Emotional Pressure Today’s Teens Feel but Rarely Share
Across the room, Tyler, the star running back with the big smile, the one everyone assumed had it all together leaned back in his chair, spinning his pen between his fingers. On the field, he was unstoppable. In the hallways, he walked with the kind of confidence people mistook for certainty. But inside, he was unraveling. Athletes are often seen as the “strong ones,” yet studies show they experience depression at the same rates as their peers; they just do not talk about it. Tyler lived that statistic.
He had teammates he joked with, guys he could talk football with, but no one he trusted with the truth. He had one friend he could confide in superficially, but no one who knew him deeply; no one who understood the pressure he carried. His parents had split last year, and his dad moved two states away. His mom worked double shifts at the hospital, leaving before sunrise and coming home long after he’d gone to bed. Most nights, the house was dark and quiet, and Tyler ate dinner alone at the counter, scrolling through highlight reels of other athletes who seemed stronger, faster, happier.
Online, he saw boys his age posting scholarship offers, perfect bodies, perfect lives. He compared their victories to his private fears and convinced himself he was falling behind. Research shows that nearly 1 in 3 teen boys feel pressure to appear “strong” online, and many hide their stress behind humor, sports, or silence. Tyler was no different. The louder the crowd cheered on Friday nights, the more alone he felt walking off the field.
He tapped his pencil harder. Then, slowly, he picked up his paper and began to write.
The Truth Teens Admit Only When They Feel Safe
One by one, they walked up and dropped their slips inside.
Ms. Sage waited until the last student sat down. Then she opened the box.
She pulled the first slip…and read.
“I feel invisible unless someone likes my posts.”
Another.
“I delete every picture of myself. I hate how I look.”
Another.
“I check my phone 200 times a day because I’m scared I’ll miss something and people will forget me.”
Another.
“I pretend I’m confident online. I’m not.”
Another.
“I don’t know who I am without my phone and my likes.”
She paused. The room was silent. No one moved.
Then she read the one that made her throat tighten.
“I don’t want to be here anymore… Everyone else looks happy, and I feel lost, hurting, and completely alone.”
The Centers for Disease Control and Prevention (CDC) reports that 22% of teens have seriously considered suicide, and the rates are rising fastest among those who spend the most time online. Ms. Sage knew that statistic. But hearing it in her classroom, in a child’s handwriting was different.
She folded the paper gently and stifled her tears.
Breaking the Lies Teens Believe About Themselves
“This,” she said, resting her hand on the box, “is what you’re carrying; this heavy, invisible weight.”
Her voice softened.
“And you need to know something. You are not the only one. Everyone who scrolls feels this pressure in some way, even adults. Loneliness is quietly shaping all of us, more than we admit.”
She looked up, steady and kind.
“You’re not strange for feeling overwhelmed. You are not weak for feeling the ache. You’re human. And you’re not carrying this alone.”
Seeing Through the Lies of Social Media
What you see online is not real life. What you feel is real, but it is not the end of your story.” Talk with each other about truth and make a friend, knowing that what is online, is a persona, something false pretending to be real. Your “likes” should come from right here in this room or at home.
Many students wiped their eyes.
Lila reached over and squeezed another cheerleader’s hand as she began to weep uncontrollably.
For the first time all year, they weren’t scrolling. They were listening. They were human again and looking around at each other.
Ms. Sage closed the box slowly, her hands resting on the cardboard as if it were something alive. Then she looked up.
“We’re not leaving this here,” she said quietly. “Come with me.”
The students exchanged confused glances, but no one argued. She picked up the box, hugged it to her chest, and led them out of the classroom, down the hallway, and through the back doors of the school.
The winter air hit them first; sharp, clean, honest.
Behind the building, near the maintenance shed, the old janitor, Mr. Alden, stood beside a metal burn barrel. Flames licked the rim, crackling softly. He nodded at Ms. Sage. They had arranged this.
“This,” she said, holding the box tightly to her chest, “is where we let go of what we were never meant to carry alone.”
The students formed a loose circle around the barrel. No one spoke. The only sound was the fire breathing.
Letting Go of What Teens Were Never Meant to Carry Alone
Ms. Sage opened the box. The folded slips of paper, their secrets, their fears, their midnight thoughts, rustled in the wind.
“Every one of you wrote something real,” she said. “Something heavy. Something you’ve been holding in the dark. Today, we burn the lies that told you were alone and not seen.”
She lifted the box and tipped it gently. One by one, the papers slid into the flames. They curled, blackened, and disappeared.
A hush fell over the group. Some students stepped closer. Others wiped their eyes. Jordan and several boys shoved their hands into their pockets, blinking hard as they fought the ache. Lila and the cheerleader teammate mirrored each other without meaning to, arms wrapped tightly around their own bodies, heads bowed as tears were blinked back and slipping free. They stood in a protective posture girls slip into when they don’t want anyone to see them break, watching the fire as if it were rewriting their stories.
Suzy pressed her head into her cane as rocked back and forth trying to comfort her pain. John stood next to her like a statue, gripping his cane so tightly his knuckles turned white, as he fought back tears.
Burning Lies
Because as the papers burned, they weren’t just burning confessions, they were burning the lies they had believed about themselves. The lie that they weren’t enough. Continued lie that everyone else was happier. The lie that they were alone. The lie that their worth depended on likes, followers, or filters.
Tyler stepped forward. He reached out and waved the ashes and said “goodbye”, a quiet, aching release. Then another hand lifted beside him with “goodbye”. And another. And another. Soon the whole group stood around the barrel, their hands rising over the heat, each wave a soft, brave goodbye to the weight they had carried… and a trembling welcome to the freedom they were finally claiming.
No one rushed or joked or hid.
When the last ember died, Ms. Sage spoke again, her voice steady.
“You don’t walk alone,” she said. “And the lies you waved goodbye to… they’re gone. You don’t have to carry them anymore.”
Returning to the Classroom with a New Strength and Solidarity
They stood there a moment longer, breathing in the cold air, feeling lighter than they had in years.
Then, slowly, they walked back inside; not as strangers scattered across rows, but as a group bound by the truth that they were more alike than different.
They were not alone.
Learning to Use Social Media Without Losing Yourself
Quitting social media isn’t really an option in this day and age; it’s about learning how to use it differently, in ways that lift you instead of draining you. You can follow people who inspire you, mute the accounts that make you compare yourself or feel worse about who you are, set smaller time limits (even a simple timer on your phone helps), and remind yourself that real connection happens in real conversations.
And when you look up from your screen, you’ll start to notice the people around you, classmates who hurt too, who could use a friend, who might become real friends if you gave them a chance. Speak to someone at school, or give someone a call after school, invite them over for pizza and a movie, make popcorn, hang out, or get a couple of people together just to laugh and talk. You don’t need perfection to feel better, just a healthier rhythm, a middle ground where your screen doesn’t get to decide your worth or your friendships.
Faith Reflection: The God Who Sees the Overwhelmed and Brokenhearted
When life feels heavy and everyone else online looks happier, God sees what you’re carrying — the real you, not the filtered version. In Scripture, Hagar calls Him “El Roi — the God who sees me.” He sees your hurt, your questions, your loneliness, and He doesn’t look away.
Psalm 34:18 says, “The Lord is close to the brokenhearted.” Not just the strong. Not just the confident. The brokenhearted.
The thoughts you wrote down — the lies you’ve believed — don’t define you. God’s truth does.
You are loved. And chosen. You are enough. And you are not alone.
Even on the days you feel invisible, God whispers: “I see you. I’m with you. I’m not letting go.
Learning how to teach or learn Nemeth math using assistive technology can seem challenging, but with the right tools and approach, it becomes manageable and effective. Whether you’re a parent helping your child, an educator supporting students, or an independent learner, using a Focus 40 Braille Display and JAWS screen reader provides an accessible way to master Nemeth code. In this guide, I will walk you through setting up your technology and using the Braille Math Editor to confidently teach and learn math concepts from basic arithmetic to advanced algebra. Let’s simplify the process and enhance your skills.
Setup Nemeth with JAWS
Start by setting JAWS to the proper Nemeth settings. Access the JAWS Settings Center with Insert + 6 then Control+Shift+D to set default: type “Braille m” in the search box. Navigate to “Braille Mode” and make sure you hear “Structured” mode, ensuring that both the active cursor and Braille cursor follow each other. This will allow you to track what the student is doing on their display.
Alt + F to language profiles, and alt + D to details. Once open Alt + M to math options and up arrow to Nemeth if it is not selected. This will ensure that math expressions are correctly read and displayed in Nemeth Braille. Enter to close, Alt + A to apply and enter to close.
Teach or learn Nemeth JAWS, braille display and BME
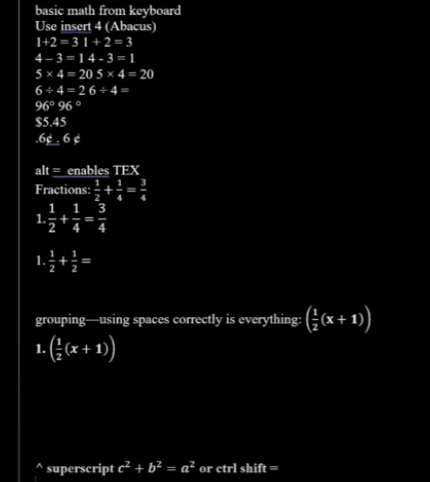
Using the Braille Math Editor is key to teaching and learning math effectively. Type out equations like “1+2=3” or more complex algebraic expressions, and feel the Braille output directly on your Braille display. Correct mistakes quickly using the Braille display and JAWS auditory feedback, making it easy to follow along. Use the Braille Viewer to see it visually and compare with the Braille Display by opening JAWS context menu, go to Utilities and Braille Viewer to turn it on.
This step-by-step approach works for basic arithmetic to complex math such as algebra, Trigonometry, calculus and beyond. Both the Braille Math Editor and Word Math Editor can help you visualize and interact with Nemeth code to easily learn it and/or teach others. Practice consistently to improve your tactile reading skills and build confidence in math.
By following this guide, you’ll gain the tools to teach and learn Nemeth math efficiently, whether for yourself or for your students.
Dr. Denise M. Robinson, PhD, CTVI, AT, and CEO of TechVision, LLC, leads worldwide remote teaching for blind and low vision students. Her YouTube channel, @DrDeniseMRobinsontech and this website, showcases making digital math accessible with MathCat with JAWS, or NVDA. This video provides 8 different ways to complete digital math with several options using the Braille Math Editor in WORD for UEB or Nemeth math, highlighting the advantages of Nemeth or UEB via MathCat. Links with full video lessons from this video follow. She also demonstrates reading math on a Braille display and creating or making complex formulas accessible. AI tools like MathKicker.AI enhance efficiency. The series includes geometry and graphing with Desmos. Dr. Robinson emphasizes that digital access is crucial for competitive education and inclusion with peers. Learn how to teach or Learn UEB Math Code.
Nemeth or UEB via MathCat: 8 videos on Math Access in WORD and Braille Math Editor with JAWS or NVDA
Life IS a competition and Digital access is key with Instruction
Life is a competition, and digital access is essential. It levels the playing field, enabling equal opportunities for everyone. Digital tools enhance skills and productivity. They open doors to education and employment. Having a qualified access technology instructor is crucial for teaching students Nemeth and UEB math codes to access everything their peers do. Embracing technology is vital for success and inclusion in today’s world. MathKicker. AI for Matrices with NVDA or JAWS-Speed in completing Work
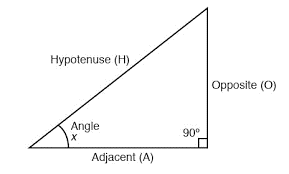
To enter college, you need a foundation in Algebra and Geometry. For STEM fields, add Calculus and Trigonometry. Trigonometry studies the relationships between angles and sides of triangles. With tools like Trigonometry with Math Editor, Braille Math Editor and screen readers, you can easily explore these relationships. It uses sine, cosine, and tangent functions to relate angles to side lengths. These functions are essential in physics, engineering, and astronomy. They help solve problems involving distances and angles. For example, trigonometry determines the height of a building or the distance across a river without direct measurement.
Trigonometry provides tools to model and solve problems involving angles and distances. It is fundamental to mathematics and its applications.
Going to College
If you go into STEM field IN college, you need advanced classes in but not limited to college algebra, trigonometry and calculus. When you are a screen reader and Braille user, these skills will allow you the options and opportunities to complete work as sighted peers.
Let’s talk about: Trigonometry which is a branch of mathematics that studies the relationships between the angles and sides of triangles
Right triangle for Trigonometry with math editor
You can copy this content and paste into WORD OFFICE 365. Make sure you select Math 1 at a time and alt = to turn into true math. Then you can Ctrl = to change to professional or keep the LaTex then enter and braille it in again using Nemeth or UEB Math or practice LaTex.
Problem 1: Finding the Length of a Side
Given: A right triangle with one angle of 30° and the hypotenuse of 10 units. Find: The length of the side opposite the 30° angle.
More options for JUST auditory learners or braille learners and taking totally inaccessible images of WORD and making them accessible using Mathkicker.AI.
In this video, Dr. Denise M. Robinson demonstrates how to use the WORD Math Editor and Braille Math Editor with JAWS using LaTeX or Braille. This tutorial is designed for screen reader users, with or without braille displays, who want to improve their math skills.
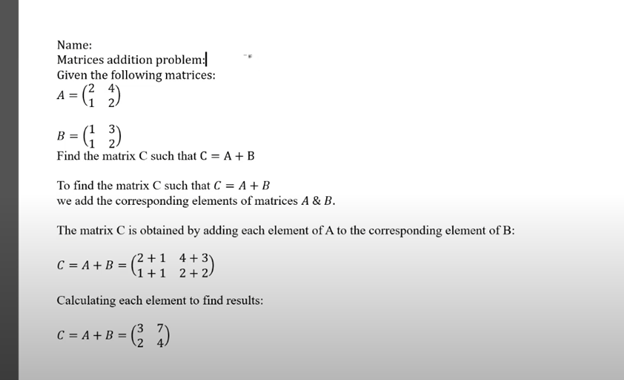
First, Dr. Robinson introduces the essential tools for using matrices in WORD, including JAWS, a Braille display (if desired), and the WORD Math Editor. She explains how to set up each tool to work together smoothly, which is crucial for creating and editing math content.
Next, the video focuses on creating matrices. Dr. Robinson uses LaTeX to input mathematical expressions. She explains each step clearly, making it easy to follow along. Viewers will learn how to enter rows and columns in a matrix, helping them understand matrix structure.
Then, Dr. Robinson demonstrates how to use auditory feedback, which allows users to hear the math content they are working on. This feature helps ensure accuracy and makes it easier to catch mistakes. Additionally, she shows how to switch between auditory and Braille feedback, providing flexibility for different learning styles.
The video also covers using the Braille display with the math editors. Dr. Robinson explains how to navigate through the matrix using Braille and provides tips on reading and editing the content efficiently. This section is particularly helpful for users who rely on Braille for their work.
Finally, the tutorial concludes with a review of the key points. Dr. Robinson summarizes the steps for creating and editing matrices. She encourages viewers to practice using the tools and techniques demonstrated in the video. By the end of the tutorial, users will feel more confident in their ability to work with math content.
To emboss math with braille blaster content from Microsoft Word, start by creating equations in the Math Editor. This tool helps you write complex mathematical expressions clearly. Once you finish, save the document in a .DOCX format, which is compatible with Braille Blaster and other embossing software.
Next, open Braille Blaster and import your Word document. The software automatically converts your math content into Nemeth code, the Braille standard for mathematics. This conversion ensures visually impaired readers can understand the material. Moreover, Braille Blaster allows quick switching between Unified English Braille (UEB) and Nemeth codes, offering flexibility based on the user’s needs.
After conversion, to emboss math with Braille Blaster, send the document directly to a Braille embosser. This machine prints the digital Braille content as physical Braille that can be read by touch. Transitioning from digital to physical Braille is quick and efficient with this process.
Furthermore, this workflow supports various mathematical formats, making it versatile for different educational levels. For instance, whether you’re working on basic arithmetic or advanced calculus, the combination of Word and Braille Blaster handles it smoothly. This versatility is crucial in educational environments where diverse math content is necessary.
Advanced Features
Educators can also take advantage of Braille Blaster’s advanced features, such as the ability to preview the Braille output before embossing. This step allows for checking accuracy and making any necessary adjustments. It’s particularly useful when dealing with intricate math equations that require precise formatting. If you would like to combine this with a graph, Desmos is your key with Tiger software.
Moreover, the ability to seamlessly switch between UEB and Nemeth within the same document saves time and ensures consistency across educational materials. This dual-mode capability is essential for creating comprehensive resources that cater to different learning needs.
Using Word’s Math Editor, Braille Blaster, and a Braille embosser not only streamlines the creation of accessible math materials but also enhances the educational experience for visually impaired students. This efficient process ensures that high-quality Braille math content is readily available, supporting inclusive education and empowering students to succeed in their studies. By implementing this workflow, educators can deliver timely, accurate, and accessible learning materials that meet the diverse needs of all students. Here are options if you would like to use NVDA for Math. And to take any math 1 step further in creating graphics, Tiger and graphic embosser will take you there.
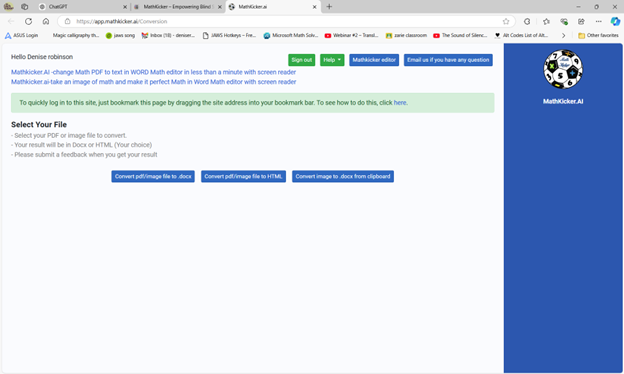
Dr. Robinson demonstrates how transcribers can efficiently convert math images into text using accessible Word documents and MathKicker.AI. She begins by showing how to identify an image containing a math problem. Note, that it turns blue when clicked and often appears blurry for a hint of inaccessible. To convert the image, she uses the “Windows + Shift + S” command to capture the image, then pastes it into MathKicker using “Alt + V.” After converting the image, she opens the document in Word.
Dr. Robinson advises transcribers to compare the original image with the converted text to ensure accuracy. She recommends using “F12” to save the document and “Alt + D” to choose the save location. For side-by-side comparison, she suggests using “Alt + Space” and “R” to restore and resize the windows.
For Transcribers to convert math images into text
To describe number lines or graphs, transcribers should write out the details, such as the range and direction of the line. Dr. Robinson also shows how to add alt text to images by right-clicking and selecting “View Alt Text.” This feature is particularly useful for visually impaired students who rely on screen readers.
For inequalities and other math problems, Dr. Robinson explains how to use Desmos, a graphing calculator tool. She demonstrates how to type equations into Desmos and capture the graph using “Alt + Print Screen.” The captured graph can then be pasted into the Word document, and additional descriptions should be provided for clarity.
Finally, Dr. Robinson emphasizes the importance of proofreading and adjusting the text to ensure it accurately represents the math content. She encourages transcribers to use MathKicker for quick and accurate transcriptions, highlighting its ability to create accessible math documents efficiently.
Student Hayes has issues completing math in WORD as her label number do not read. Dr. Robinson demonstrates how to resolve issues with auto-numbering in Word. She first identifies that automatic numbering is causing issues for the student using dot 2 and space in the Brailliant Braille display, especially when numbers appear incorrectly on the Braille display. To address this, she instructs to press “Alt + F” to open the File menu, followed by “T” for options, then “P” for proofing, and finally “Alt + A” to access AutoCorrect options.
She guides users through unchecking five specific boxes that affect text formatting, ensuring the correct settings are applied. Dr. Robinson emphasizes the importance of turning off automatic numbered lists, which often causes unexpected changes in documents.
After confirming the settings, she instructs on how to apply these changes by pressing “Enter” to save them. This step ensures the document is correctly formatted and ready for the student to use in MathKicker.AI.
Braille Viewer to accurately solve math problems
Next, Dr. Robinson advises turning on the Braille viewer. Using the Jaws context menu and U, to navigate to the utilities to access the Braille viewer. Braille viewer allows the teacher to view the math problems correctly on student screen in Braille. While student uses fingers to read display.
Then Dr. Robinson explains how to use the Math Viewer by pressing “Insert + Space + Equals.” This enables the student to navigate through the math content character by character. This command helps ensure accuracy in reading and solving math problems, especially when using Braille displays.
Finally, she explains how to open the Braille Math Editor now that auto numbering issues are resolved. Eventually, she will learn how to use split braille on her display. Student can braille equations in Nemeth code, and ensure that each step of the problem is correct to accurately solve math problems. Dr. Robinson highlights how the Math Editor will not accept incomplete or incorrect inputs. The student cannot close the editor without fixing errors. This method reinforces correct equation formatting. It ensures students accurately solve math problems using auditory and Braille math tools.
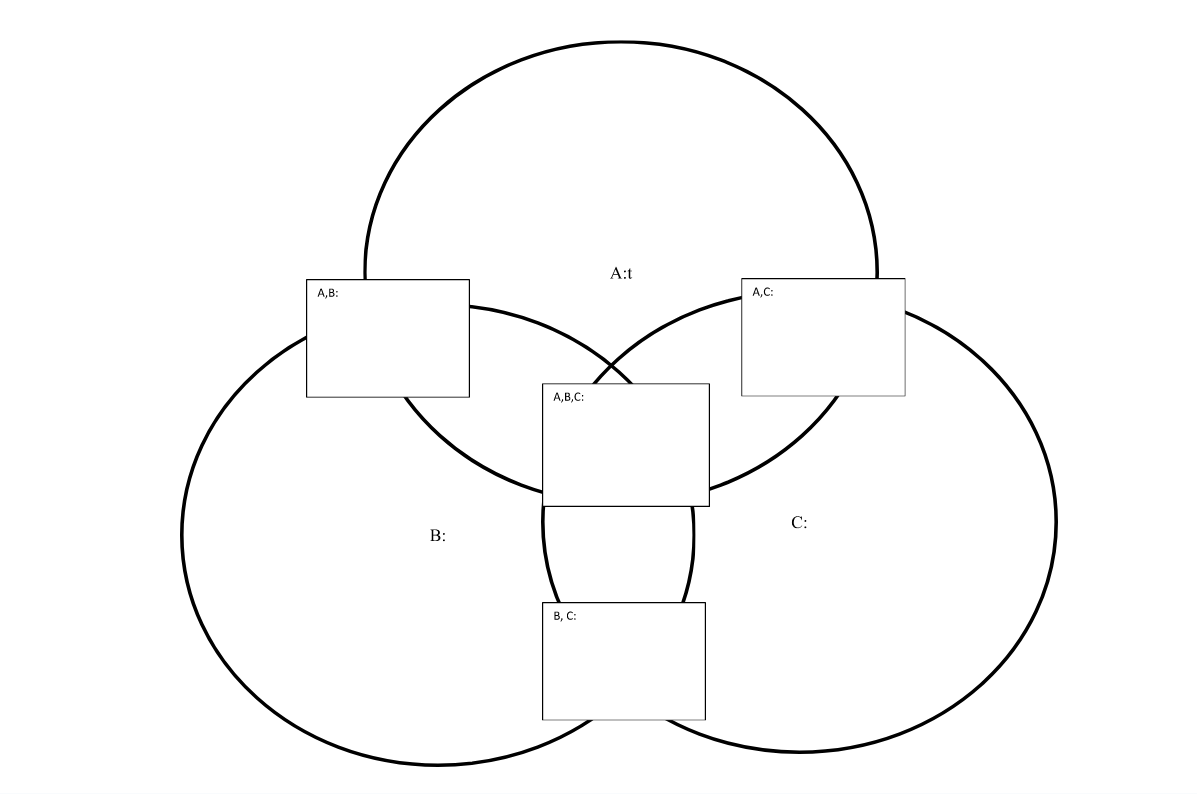
Using Venn diagrams with screen readers involves strategic design and specific keyboard commands to ensure accessibility. Each set in the diagram must have clear, descriptive labels to guide screen reader users effectively. These labels help users understand the content without needing visual cues. Alt text plays a crucial role by summarizing the Venn diagram’s purpose, the sets involved, and their intersections. This concise description enables screen reader users to grasp the diagram’s structure and intent.
Keyboard navigation is essential for screen reader users to interact with Venn diagrams. The Tab key allows users to move through interactive elements like text boxes or linked descriptions associated with the diagram. Arrow keys are useful for navigating within tables or text boxes that describe the diagram’s content. This functionality ensures that users can access all relevant information without relying on visual input.
Screen reader software, like JAWS or NVDA, includes commands that facilitate navigation. In JAWS, the Ctrl+H command lets users jump between headings, making it easier to navigate through complex content. NVDA users can use the Ctrl+Alt+Arrow keys to move between headings or landmarks within a webpage or document. These commands are vital for quickly accessing different parts of the content related to the Venn diagram.
Incorporating structured content enhances the usability of Venn diagrams for screen reader users. Headings, bullet points, and numbered lists help break down complex information into manageable sections. This structure allows users to follow the logical flow of information without confusion. So, Screen reader users can also navigate through tables that complement the Venn diagram. Tables list elements within each set and describe intersections, making the relationships between sets clear. JAWS users can move horizontally between cells using Ctrl+Alt+Right/Left Arrow keys, and vertically with Ctrl+Alt+Up/Down Arrow keys.
Careful Planning
Creating accessible Venn diagrams for screen reader users requires careful planning. By using descriptive text, alt text, structured content, and keyboard commands, educators and content creators can ensure that all users, including those who rely on screen readers, can effectively interact with and understand Venn diagrams. These strategies are essential for making complex visual information accessible to everyone. More Video Lessons here
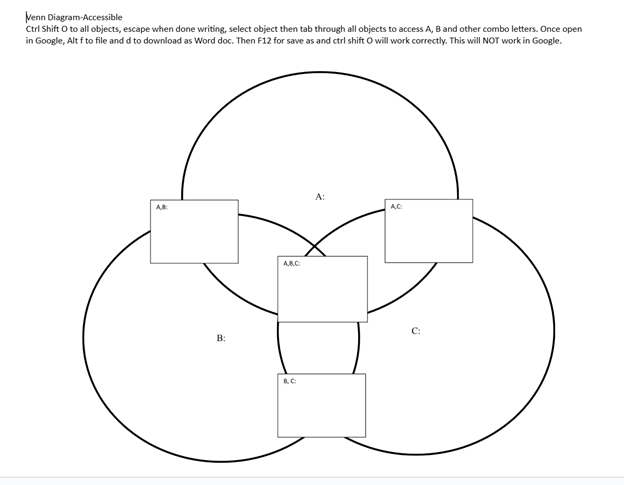
Create your Venn Diagram via WORD and shapes, applications key to move to back or forward then use these commands to access: Venn Diagram-Accessible
Ctrl Shift O to all objects, escape when done writing, select object then tab through all objects to access A, B and other combo letters. Once open in Google, Alt f to file and d to download as Word doc. Then F12 for save as and Ctrl Shift O will work correctly. This will NOT work in Google.
When done, have student emboss off a copy to feel what it is like and if you are having computer issues, tweak it to work better with screen reader.
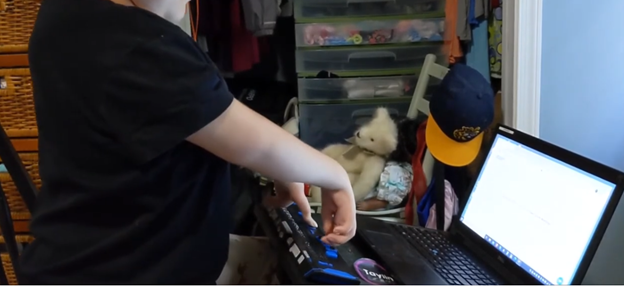
Kaleigh was born with very special hands. So, whether you have 10 fingers or 2 or 3, there is always an easy way to use a braille display to control your computer.
Computer Local Admin access is Crucial at all education levels. Dr. Robinson, an Assistive Technology and IT specialist, sets up, maintains, and controls all the computers used in TechVision programs while TechVision Team continues teaching students to manage their own technology. She emphasizes the importance of blind students having local admin access on their school computers so they can make necessary updates and changes to their laptops as needed.
Firstly, she highlights that anti-virus software like Kaspersky or Sophos often interferes with screen readers. Instead, Dr. Robinson recommends using Malwarebytes with Microsoft Defender, as it provides strong protection without disrupting screen reader functionality. Having Computer Local Admin access ensures students can implement these software changes.
Dr. Robinson also explains the need for screen readers such as JAWS. Schools often filter out essential websites and programs like Freedom Scientific, which students require for their studies. With local admin access, students can update their screen readers and related software, which is necessary to keep their devices running smoothly. These updates are crucial and happen every few months. Computer Local Admin access allows students to manage these updates efficiently.
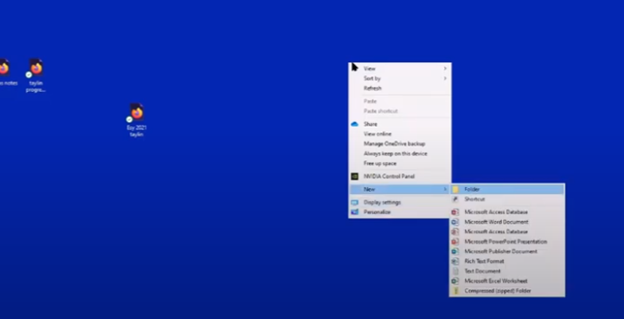
In addition, students must manage their desktops efficiently. They need to pin important programs, such as JAWS, to the taskbar for quick access and adjust their settings without assistance. Pinning their school sites to the desktop make quick access to any site. Through the context menu, students can navigate and personalize their desktop to meet their needs.
Computer Local Admin access to Applications Key on desktop to access anything on the computer
The run dialog box is another essential tool with CTRL+R. Students need to clear temporary files, which can slow down screen readers. Since screen readers are memory-intensive, removing these files improves both the computer’s speed and network performance. Computer Local Admin access is required for these maintenance tasks.
Dr. Robinson further emphasizes the importance of Office 365, especially for math tasks. Using the math editor, students can create and solve equations that read seamlessly on a braille display. This access is crucial for academic success, particularly in STEM subjects.
Lastly, Dr. Robinson stresses the necessity of file explorer -Windows+E and Bluetooth settings. Without a mouse, blind students rely on file explorer to organize their files. Bluetooth access is also essential for reconnecting braille displays and other devices.
In summary, Dr. Robinson believes local admin rights are essential for blind students to manage their technology independently, keep their devices updated, and fully engage in their education. This allows them full access for a lifetime. The TechVision Team ensures students learn essential skills to manage and update their devices independently, preparing them for a lifetime of technological adaptation. As technology evolves, these skills are crucial. Computer Local Admin access is vital for securing and maintaining employment so they know the updates needed, in an increasingly digital world.
JEFFERSON COUNTY, Tenn. As school resumed, a Jefferson County student waited weeks for an important textbook to arrive from out of state. This doesn’t seem like a big deal, except it’s a calculus book for Math for blind students and it’s written in Braille. Campbell Rutherford is a home school student in Jefferson County.
She started homeschooling with a teacher for the visually impaired because math for blind students was no longer available in the local school district. Campbell was born blind and has been reading braille since she was 3 years old. “I rely completely on braille and screen readers to access the printed word,” she said. Campbell, accustomed to reading Braille, competes in state Braille reading competitions yearly and has even reached nationals. So naturally, she’d like to be able to read her textbooks in Braille.
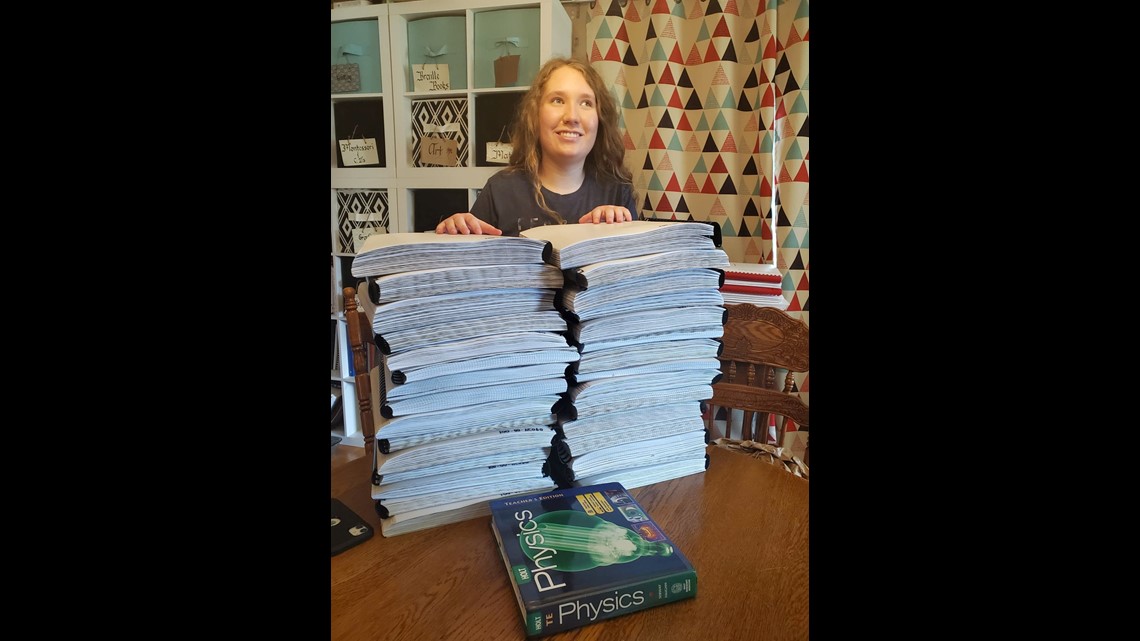
Because each page has to be embossed with the Braille indentations, Campbell’s textbooks are huge. Here’s her AP physics book. All these binders are one book for Math for blind students, containing everything in the print book next to it, just in Braille.
Credit: Liza Rutherford: Campbell Rutherford stands with her AP Physics book in Braille of 25 volumes of 11 x11.5 size, next to the book in print of 2 inches thick.
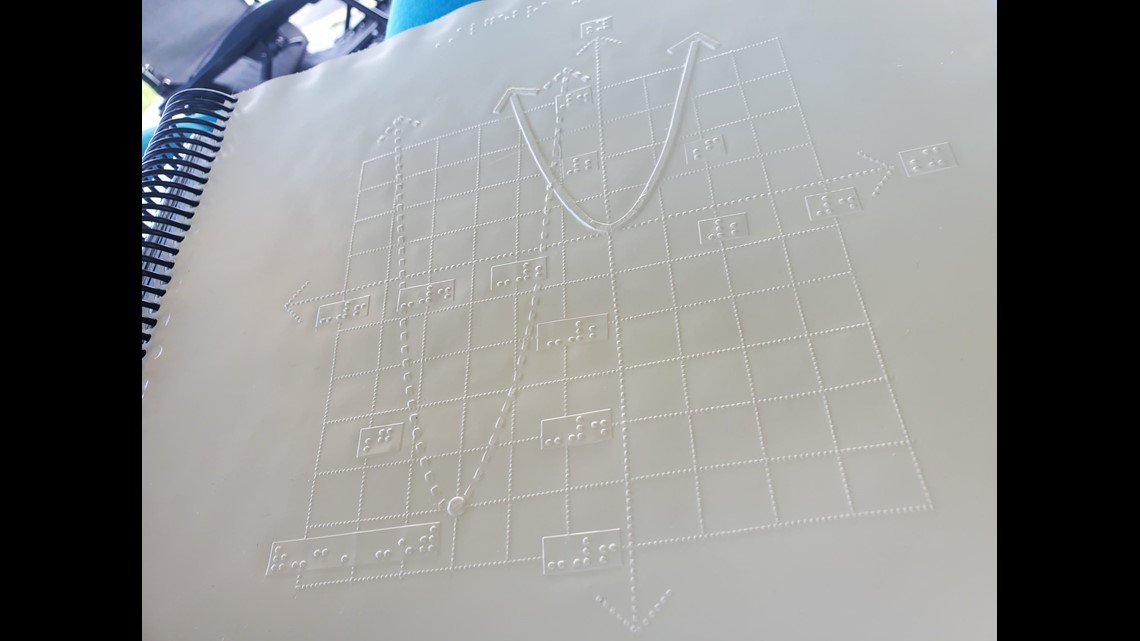
“I used to have to borrow a truck to go get her books,” said her mom, Liza Rutherford. Braille books are larger because the text must be big enough for readers to feel with their fingertips. A standard physics book may have four graphs on one page, but in Braille, each graph requires its own page. The National Braille Press reported about 12 percent of blind school-age students can read Braille, limiting access to advanced textbooks.
NO AP Math Books
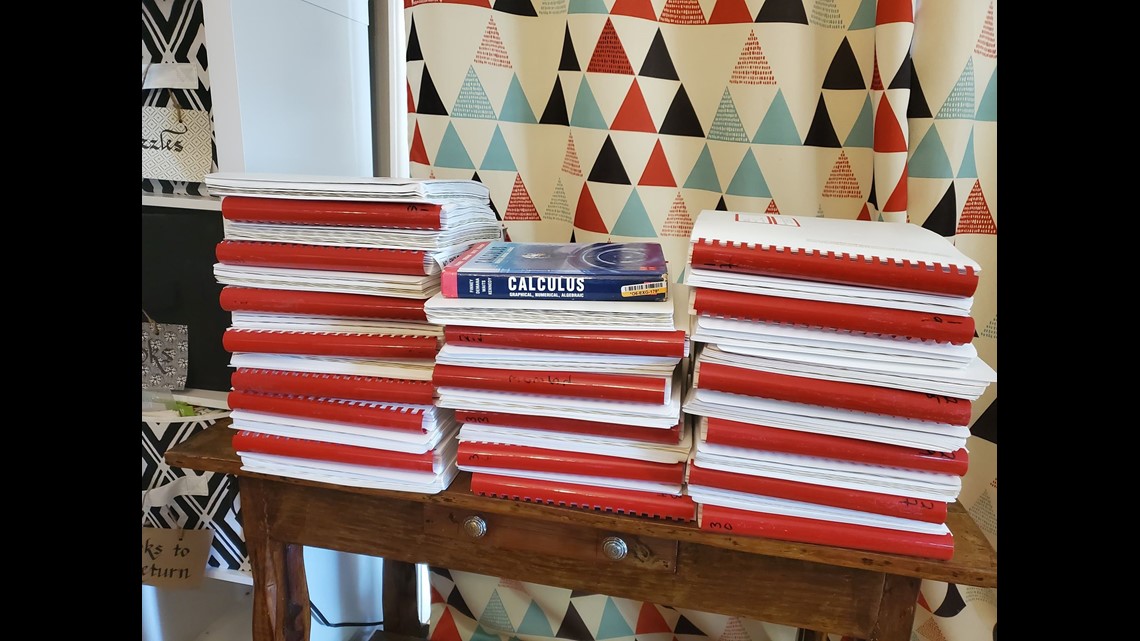
There were no Braille AP calculus books in the state of Tennessee. The Rutherford’s worked with the Tennessee School for the Blind to find this 20-year-old edition from Maryland. Campbell said schools often discourage visually impaired students from taking challenging courses. “I have friends that, when they’re struggling with Math, they’ve been told, ‘it’s okay that blind people aren’t good at math typically,’” said Campbell.
Credit: Liza Rutherford-Campbell Rutherford’s calculus book in Braille of 32 volumes of 11 x11.5 size, by to the book in print of 2 inches thick..
Campbell plans to major in math in college and go into epidemiology. She said it’s those low expectations that hinder her and others the most, not her lack of vision. “We even had an administrator at one point come to me and say, ‘does Campbell really need a high school diploma for her adult life?’” said her mom Liza Rutherford. “That’s probably the one that’s infuriated me the most over the years,” said Campbell.
Lack of Advanced Placement (AP) Math for blind students Books
The National Federation for the Blind reported only 31.6 percent of blind individuals hold a high school diploma or GED. The Rutherford’s believe a shortage of teachers for the visually impaired adds to this problem.
Credit: Liza Rutherford: A mathematical graph transcribed in Braille.
They are hopeful that as technology spreads, more blind students will have the educational access they need. “There are other ways of doing things besides the sighted way or the able way,” said Campbell. Campbell connected with a blind math professor from Connecticut who assists her with any course-related questions. She took AP physics and AP calculus with a proctor who will describe the graphs and record her multiple-choice answers.
Math for all ages, Math Team, Dr. Robinson, along with Professor Betsey, Campbell Rutherford (teacher intern), led the session. Nate Kile (Access Tech Specialist) was the moderator. Math Team emphasized the importance of ensuring blind students can access their technology independently and efficiently. Nate Kile assisted by handling participant questions during the presentation, allowing attendees to type inquiries in the Zoom chat box. Mr Kile would ask the Math Team from the virtual attendees.
Each presenter built on the others’ lessons. Dr. Robinson began with elementary math training skills and how JAWS and other assistive technologies play crucial roles in blind students’ education. Teaching math for all ages, she typed out typically math problems in elementary school to show audience how easily math is completed in WORD. Nate provided opportunities for participants to unmute themselves using Alt + A or Alt + M to ask questions.
Math for all Ages: Dr Robinson
The Math Team turned off their videos to optimize bandwidth. When teaching virtually, turning off video offers better bandwidth for a flow of uninterrupted instruction. Dr. Robinson started the discussion by running JAWS, a screen reader. She explained how to troubleshoot JAWS issues, recommending minimizing programs and restarting the software for optimal performance.
The session highlighted key JAWS commands, such as Windows + D for quick access to the desktop. Dr. Robinson demonstrated how blind students could use Braille displays for math, including Nemeth code. She showed how blind students control their computers by personalizing settings like screen readers and Bluetooth. Customizing the setup is essential for supporting math learning at all ages.
Math for all ages math formulas in Word
Math for all Ages: Professor Betsey
Professor Betsey demonstrated how to effectively use Braille displays, including advanced setups for students. She went into MathType and LaTex and how to use advanced Math techniques to accomplish all math levels. She emphasized the importance of maintaining accessibility and autonomy for students through personalized settings. As a college-level math professor, she explains that using a PC for math enables full inclusion of blind students. Prof. Betsey emphasizes that this technology allows blind students to participate equally in all aspects of their education. This approach supports the goal of providing math for all ages.
Math for all Ages: Campbell
Campbell Rutherford, a teacher intern, demonstrated how to integrate graphing and mathematical functions using accessible technology for blind students. Campbell began by demonstrating how to write a function in Word using LaTeX. She then transitioned to graphing that function in Desmos, an online graphing calculator. Using her braille display and screen reader, she input and analyzed the graph. Campbell explained how blind students can explore mathematical properties like intercepts and undefined points. After reviewing the graph, she took a screenshot and pasted it into a Word document. This tied together the written mathematical properties and the visual representation. Throughout, Campbell stressed the importance of accessible math for students of all ages.
Throughout the session, the Math Team emphasized the importance of managing constant software updates. They explained how providing local admin rights empowers students to update their programs and devices independently. This in-turn prepares them for both academic success and future employment. The TechVision team’s approach ensures that students can fully access their education and maintain control of their technology. This ultimately sets them up for long-term success but especially the STEM field. More Math Lessons here:
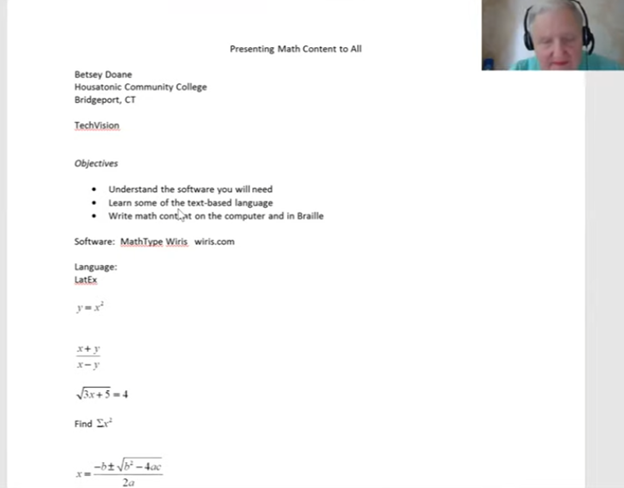
Dr. Betsey Doane shared her experience teaching math for over 50 years and the importance of making math accessible to all students, including those with visual impairments. She began by introducing the software MathType, essential for creating accessible math content. The software integrates into Word and allows users to write math that is accessible to both screen readers and braille displays. Her efforts truly embody the concept of Advanced Math Made Accessible.
Dr. Doane explained the basics of LaTeX, a text-based language used for writing math. She demonstrated how to input and translate common math expressions such as fractions, square roots, and equations using LaTeX in Word. Her instructions included using the Focus 40 Braille Display and ensuring proper configurations for students to view math content in braille. This approach makes advanced math more accessible for everyone.
LaTex using Mathtype to insert perfect Advanced math made accessible
She emphasized the importance of understanding both the visual and non-visual ways of presenting math, highlighting that students need the right software and commands to work effectively. By using LaTeX and MathType, both sighted and blind students can access and solve math problems, ensuring inclusion in any classroom setting. This makes advanced math accessible and easier to understand.
She highlighted the use of MathType software, which integrates seamlessly with Microsoft Word, allowing users to create and present math content that is accessible through screen readers like JAWS and braille displays like the Focus 40. Dr. Doane explained how MathType enables students and educators to write complex equations, such as fractions, square roots, and exponents, in both visual and non-visual formats. This ensures that blind students can access the same content as their sighted peers, making advanced math more accessible.
Advanced Math Made Accessible with LaTex
Dr. Doane also provided an introduction to LaTeX, a powerful text-based language used for writing mathematical expressions. She demonstrated how to write math using LaTeX syntax, such as using backslashes for commands like fractions and square roots. By using LaTeX in Word with MathType, math content can be rendered correctly on both screen readers and braille displays, making it easier for blind students to follow along in class and complete assignments. This is another way to make advanced math accessible.
Furthermore, Dr. Doane stressed the importance of configuring braille displays correctly, ensuring that input is set to computer braille and output is set to grade 2. She provided step-by-step instructions for adjusting these settings on the Focus 40 Braille Display, ensuring that students can navigate math content effectively, contributing to the overall goal of making advanced math accessible.
In conclusion, Dr. Doane encouraged educators to adopt these tools and techniques to create an inclusive learning environment where both sighted and blind students can excel in mathematics. Her detailed instructions and practical advice offer a clear path toward accessible math education for all.
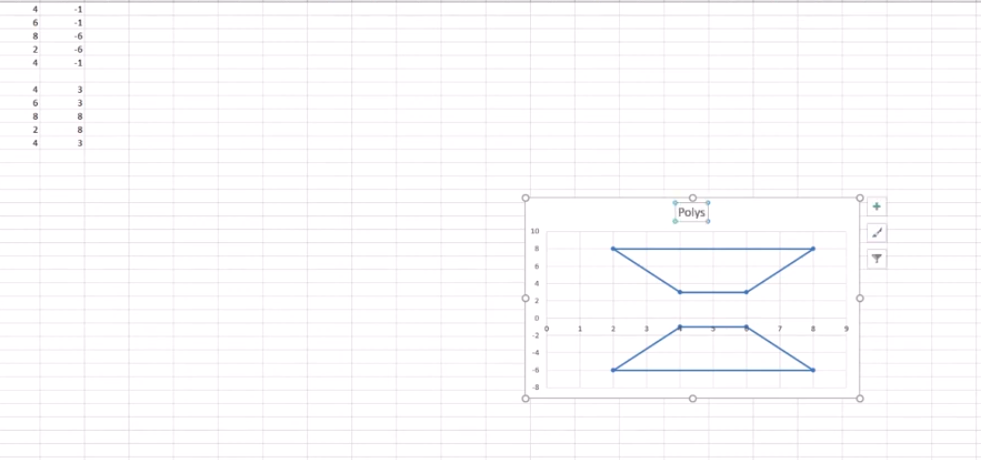
Using Excel for geometry tasks, such as inserting shapes and labeling graphs, can be highly effective, especially for visually impaired students. By leveraging keyboard commands, students can efficiently navigate through Excel’s features. For instance, pressing Alt + N opens the Insert tab, and SH brings up the Shapes menu, allowing users to select and draw shapes. To label a graph, students can use Alt + JC to access the Chart Tools Design tab, followed by A to add chart elements like data labels and titles. These steps not only enhance the learning experience but also demonstrate the power of assistive technology in making complex tasks accessible and manageable
Start at the top of A1 and start adding data in both A and B. Make sure you add a space between you 2 Geometric shapes so they can mirror each other or whatever the assignment requires.
Here are other options for Geometry shapes
Here’s how you can insert shapes and label a graph in Excel using keyboard commands:
Geometry: create Shapes and label graphs
Excel for Geometry: Create Shapes and Label Graph
Inserting Shapes
Open Excel and navigate to the worksheet where you want to insert shapes.
Press Alt to activate the ribbon shortcuts.
Press N to go to the Insert tab.
Press SH to open the Shapes menu.
Use the arrow keys to select the shape you want, then press Enter.
Click and drag (or use arrow keys) to draw the shape on your worksheet.
Labeling a Graph
Select your chart by pressing Ctrl + Arrow keys to navigate to it.
Press Alt to activate the ribbon shortcuts.
Press JC to go to the Chart Tools Design tab.
Press A to open the Add Chart Element menu.
Press D to select Data Labels, then choose the desired position using the arrow keys and press Enter.
Adding a Chart Title to Excel for Geometry
Select your chart.
Press Alt to activate the ribbon shortcuts.
Press JC to go to the Chart Tools Design tab.
Press A to open the Add Chart Element menu.
Press T to add a chart title, then type your title and press Enter.
These steps should help you efficiently create Shapes and label graphs in Excel using keyboard commands. If you need more detailed instructions or have any specific questions, feel free to ask!