Creating Excel Math Graphs is easy if you know the keyboard shortcuts with JAWS screen reader or NVDA. Kaylee starts by opening Excel, ready to plot the data using a scatter plot. First, she selects the A and B columns to copy them. Using the keyboard shortcut Ctrl + C, she copies the data. Once Excel is opened, she selects the cells where the data will be pasted, pressing Ctrl + V. Ensuring more rows are selected than needed, Excel warns if too many cells are selected, but Kaylee confirms the paste by selecting “Yes.”
Creating Excel Math Graphs
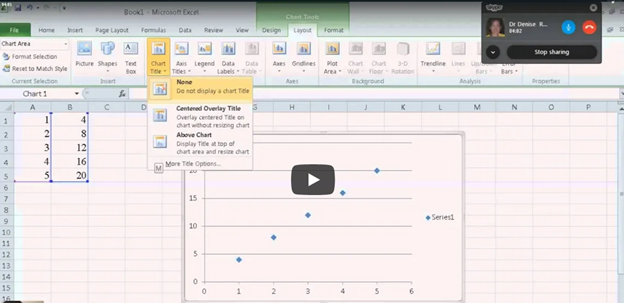
With the data ready, Kaylee moves to create a scatter plot graph. She presses Alt + N to access the “Insert” tab, navigating carefully to choose the scatter plot. After accidentally selecting the formula tab, she tries again, successfully inserting the scatter plot this time.
Next, it’s time to add titles to the chart. Kaylee presses Alt + J + L to open the “Chart Layout” options, selecting T to input the chart title. Choosing to place the title above the chart, she moves forward. For the axis titles, she uses Alt + J + A + I to access the “Axis Title” options, adding the horizontal (X) axis title first. She selects W for the primary horizontal axis and types the label. Creating Excel Math Graphs involves repeating the process for the vertical (Y) axis, she selects the “Rotated” option by pressing the down arrow and enters the appropriate title.
Ready to Submit her Excel Plot Math Graph
Kaylee removes the chart legend, which is unnecessary for this excel Plot math graph. Pressing Alt + J + L + L, she selects “None” from the legend options. After exiting the title field by pressing Esc, she copies the finished graph with Ctrl + C and pastes it into a Word document using Ctrl + V. The graph is complete and clean for submission.
Learn how to do inequalities for math class using Excel and Word with a braille display–for a complete assignment that can be emailed to teacher when done. Additionally, we will cover tips on creating accessible math graphs to ensure all students can engage with the material effectively.
This video Instruction focuses on teaching math problems, specifically inequalities and graphing, using Excel. First, they direct the students to create a template with a number line. The students then insert information using less than and greater than symbols. For instance, to show a less than symbol, they use nine dashes, with each dash representing a unit. Also try Desmos for graphing online.
Next, the students insert bullets. If they have a numpad, they use Alt+7 for a hollow bullet and Alt+9 for a solid bullet. If not, they manually insert symbols via the insert menu. The students place the bullets on the number line, ensuring they are centered by putting four dashes on each side of the bullet.
To perfectly center the number, the students use the applications key and select the center alignment option or CTRL + E. After completing their problems, they select their work with Shift+Right Arrow and copy it using CTRL+ C. They then paste it into a Microsoft Word document with Ctrl+N and Ctrl+V.
Creating Accessible Math Graphs in Excel
Finally, for creating accessible Math Graphs, the students format their work by navigating through the formatting options with the right arrow key. This process allows blind students to create graphs and inequalities just like their sighted peers. The results are impressive, with perfectly centered number lines and accurately represented inequalities. The more you practice, the closer you become to being an expert in excel.
Watch YouTube video on Creating Accessible Math Graphs
How to get a Job-Woman at PC with display and iPhone
Most jobs today use the same tools: a PC, a smartphone, and Windows workplace software. If students want a job later, they must learn these tools early. If anyone wants a job, you must master those tools with excellence. Character, consistency, loyalty, and trust — combined with strong tech skills — help people gain and keep lasting employment.
Blind and low-vision students need the same skills. They also need a screen reader, braille display, and tactile learning to access the world on equal terms.
This is why instruction cannot start late. It must start educationally at age three-as a baby from the womb just teaching parents how to help child.
Early learning builds kindergarten readiness. It keeps blind students even with their peers. Strong IEPs then protect continued teaching in tech, tactiles, and braille each year so they can keep pace with their peers.
When schools teach the right tools early, blind students enter the future ready to work, ready to compete, and ready to thrive.
Global Employment — All People
According to the International Labour Organization (ILO) and global labor data:
Employment Rate Worldwide
About 58% of people aged 15–64 are employed globally. (This includes full-time, part-time, formal and informal work.)
Another ~26% are outside the labor force (students, homemakers, retired)
~6–10% are officially unemployed (actively seeking work)
Key takeaway:Most people around the world have some form of work.
Technology Use at Work — General Global Trends
People use a mixture of technology on the job depending on industry, income level, and region.
Most tech adoption statistics come from large surveys, including:
International Telecommunication Union (ITU)
Statista digital economy surveys
World Bank ICT data
Global Workplace Analytics
These show broad patterns across sectors.
Computer Access at Work (Global Estimate)
About 70–75% of office workers worldwide use a computer at work. This includes laptops, desktops, and workstation terminals.
This varies by region:
High-income countries: ~85–90% computer use at work
Middle-income countries: ~60–75%
Low-income countries: ~30–50%
Smartphone Use at Work
Smartphones are extremely common globally, even where desktop PC penetration is lower.
Global estimates show:
85–90% of working adults use a smartphone at least daily for communication, email, scheduling, messaging, and business apps.
In many service, retail, field, and informal jobs, the smartphone is the primary computing tool.
PC vs. Mac vs. Other at Work (Global Split)
There is no exact global “one number,” but multiple tech market share sources give a snapshot of the device ecosystem used professionally:
PC / Windows
Estimated 75–80% of computers used in the workplace run Windows. This includes desktops, laptops, workstations, and enterprise systems.
Windows dominates business environments because:
Longstanding enterprise support
Broad software compatibility
Legacy systems in large organizations
Mac (macOS)
Estimated 15–20% of workplace computers.
Higher share in:
creative industries (design, media, publishing)
education and research institutions
startups and technology firms
some small business environments
Other (Linux, Chrome OS, Thin Clients)
5–10% combined share. These are more common in:
tech-savvy organizations
cloud-centric workplaces
specialized development environments
Technology People Use on the Job
Here is how technology breaks down by task:
Office / Knowledge Work
PC (Windows + Office)
Laptops, desktops
Email, Office suites, cloud apps
Collaboration tools (Slack, Teams, Zoom)
Data entry, spreadsheets
Creative / Design / Media
Mac systems are popular
Adobe Creative Suite
Video and audio editing tools
IT / Development
Split between Mac, PC, and Linux
Code editors (VS Code, Vim)
Cloud and DevOps tools
Data / Analysis
PCs for spreadsheets and databases
Macs for visualization and coding
Mobile-First Roles
Smartphones for:
communication (call, message)
scheduling
mobile apps (CRM, logistics)
Especially in:
retail
transportation
field service
Global Smartphone vs Computer at Work
Here’s a broad estimate:
Technology Type
Approx. Global Usage at Work
Smartphones
~85–90%
Desktop/Laptop Computers
~70–75%
Windows PCs
~75–80% of computer share
Macs
~15–20%
Other OS (Linux, Chrome OS)
~5–10%
Note: These percentages overlap — most people use both smartphones and computers.
WHY TECH ADOPTION LOOKS THIS WAY
Smartphones have high adoption because:
They are affordable
Widely available
Used for email, messaging, forms
Often required by employers for mobile work
PC (Windows) dominates because:
Enterprise software is built for it
IT infrastructure around Windows is mature
It’s cost-effective at scale
Mac is strong in:
Creative industries
Technology startups
Higher education
Design and media fields
SUMMARY — GLOBAL View
Employment: ~58% of adults globally are employed Smartphone use: ~85–90% use at work Computer use (general): ~70–75% use a PC/laptop Windows share: ~75–80% Mac share: ~15–20% Other OS: ~5–10%
Finding high-quality tactile graphics for advanced math often feels overwhelming, especially when you support blind students who want deeper conceptual understanding. However, you can simplify the process with a clear list of reliable sources. To begin, you can explore this curated collection of teacher-vetted tactile math libraries. These sites cover algebra and pre-calculus through Calculus I–III. In addition, they include limits, derivatives, integrals, function behavior, curves, and coordinate systems. As a result, you gain ready-to-use tactiles that strengthen conceptual learning for all students. For example, many of these graphics support problem-solving, graph analysis, and multi-step reasoning. Though the focus leans toward higher-level math, these sites still offer tactile graphics for every math level. Finally, you can review them in order, moving from the most comprehensive to excellent, knowing each one provides strong and dependable options.
The information below is in order of the most comprehensive to excellent so all options are great for finding anything you need. On the European site, just remember to select English
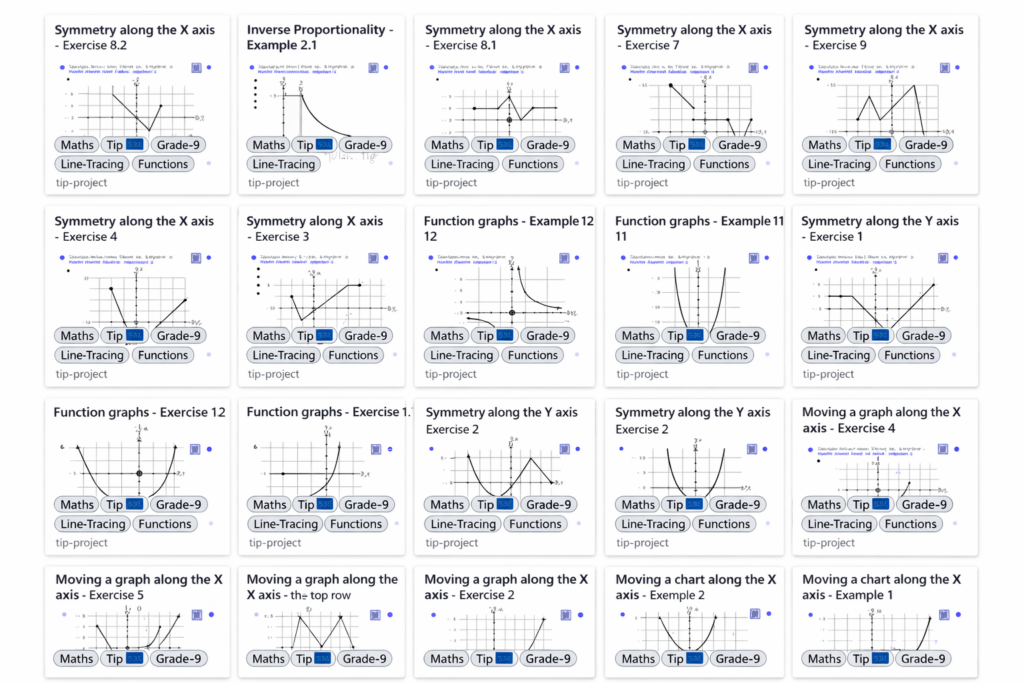
STPT = Science, Technology, Physics, and Tactile It’s one of the major content categories inside the Tactile Inclusion Project (TIP) collection.
TIP created a huge set of tactile graphics across:
Math
Science
Physics
Technology
Geometry
Calculus
Data & graphs
Best source for calculus‑level tactile graphics. This project includes audio‑tactile and swell‑paper‑ready graphics for algebra → calculus, created by math teachers for blind students.
Calculus‑related tactiles available
Limits (approaching values, left/right limits)
Derivative concepts (slopes, tangent lines)
Curve behavior (increasing/decreasing, concavity)
Graphs of functions (polynomials, exponential, trig)
Area under curves (Riemann rectangles)
Integrals (definite/indefinite visualizations)
Coordinate planes, axes, quadrants
Piecewise functions
Parametric curves
Sequences & series visuals
Optimization diagrams
Why it’s ideal for blind students:
Graphics are simplified to core mathematical meaning
Includes audio explanations
Translatable into 29 languages
Free to download
2. ProBlind — Global Database of 1,250+ Tactile Math Graphics- make sure you choose your language preference:
Calculus‑level graphics include:
Function families
Derivative slope diagrams
Concavity & inflection points
Trig function curves
Exponential/logarithmic curves
Limits & asymptotes
Area under curves
3D surfaces (simplified for tactile use)
Calculus
Limits
Derivatives (slopes, tangent lines)
Integrals (area under curves)
Concavity & inflection points
Function families
Riemann sums
Asymptotes & behavior at infinity
Pre‑Calculus & Algebra
Trig functions
Exponential/logarithmic curves
Coordinate planes
Piecewise functions
Parametric curves
Geometry & STEM
Shapes
Graphs
Data displays
3D surfaces (simplified)
All graphics are:
Swell‑paper ready
Embosser friendly
Audio‑described
Designed specifically for blind learners
Where TIP Lives Now
Because the original TIP website has a broken SSL certificate, the safe, active home for all TIP graphics is:
The TGIL was established in 2007 by the American Printing House for the Blind (APH) to support transcribers by providing free, customizable tactile graphics templates for images that are commonly used in K-12 education. The goal of the TGIL was to help speed up textbook transcription by providing a good starting point for creating high-quality tactile graphics.
While supporting transcribers remains an important part of the TGIL’s mission, we have recently expanded the scope and purpose of the TGIL to provide graphics that have been “optimized for the Monarch.” These graphics support direct-to-student delivery of graphics for use in a digital format with the Monarch multi-line tactile display.
The metadata for each graphic in TGIL will indicate whether the graphic was created for embossing and/or whether it has been optimized to display on the Monarch. We also invite users to request graphics for use on the Monarch — or request remediation of an existing graphic — when an “optimized for Monarch” alternative is not yet available.
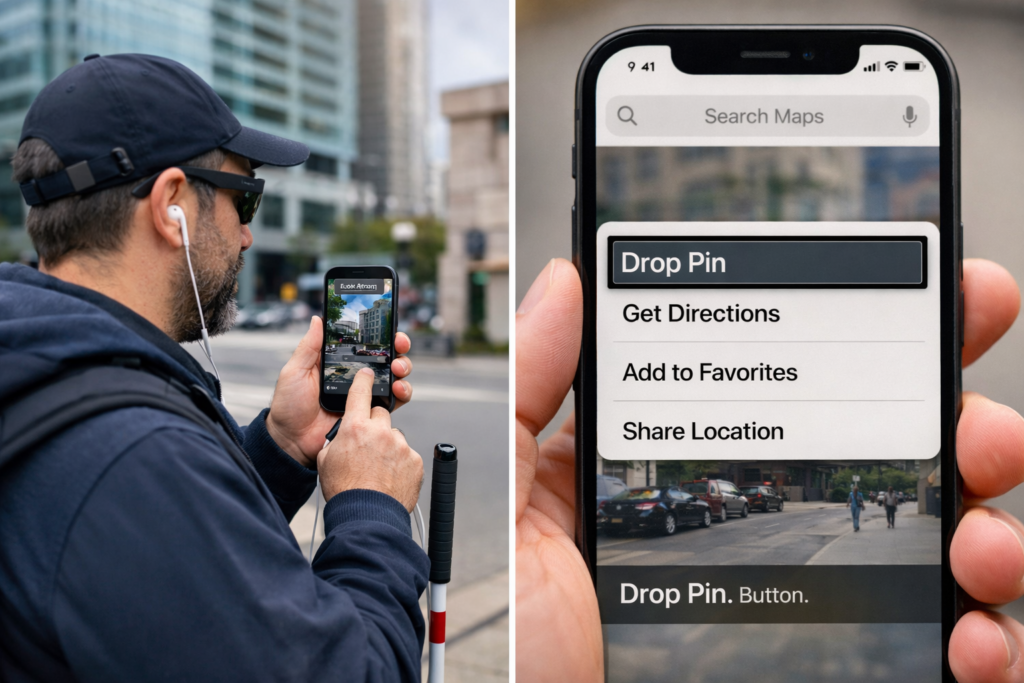
Drop a Pin with iPhone using Google Maps and Voice Over to share location with someone to come pick you up
Blind travelers build custom indoor and outdoor routes using Siri, Apple Maps, Google Maps, VoiceOver gestures, and the Compass app. These tools work together and create a reliable navigation system. Each step supports confidence and helps travelers move safely through any building or surrounding area.
Google Maps remains helpful outdoors. Apple Maps remains best for dropping labeled pins and using Siri for fast navigation.
Part 1 — Drop a Pin Using Siri and VoiceOver (Apple Maps)
Dropping labeled pins works best in Apple Maps, because Siri supports pin creation and VoiceOver announces label options clearly.
A. Drop a Pin at the Starting Location
Say, “Hey Siri, open Apple Maps.”
Wait until VoiceOver announces “Current Location.”
Flick right until you hear “Drop Pin.”
Perform a double-tap and hold to drop the pin.
Flick right to “Add Label.”
Double-tap.
Dictate a label such as “Main Room.”
Flick right to “Done.”
Double-tap to save.
B. Drop a Pin at the Next Location
Repeat the process at any hallway, office, bathroom, or exit.
Say, “Hey Siri, open Apple Maps.”
Flick to “Drop Pin.”
Double-tap and hold.
Flick to “Add Label.”
Double-tap.
Dictate “Bathroom.”
Flick to “Done.”
Double-tap.
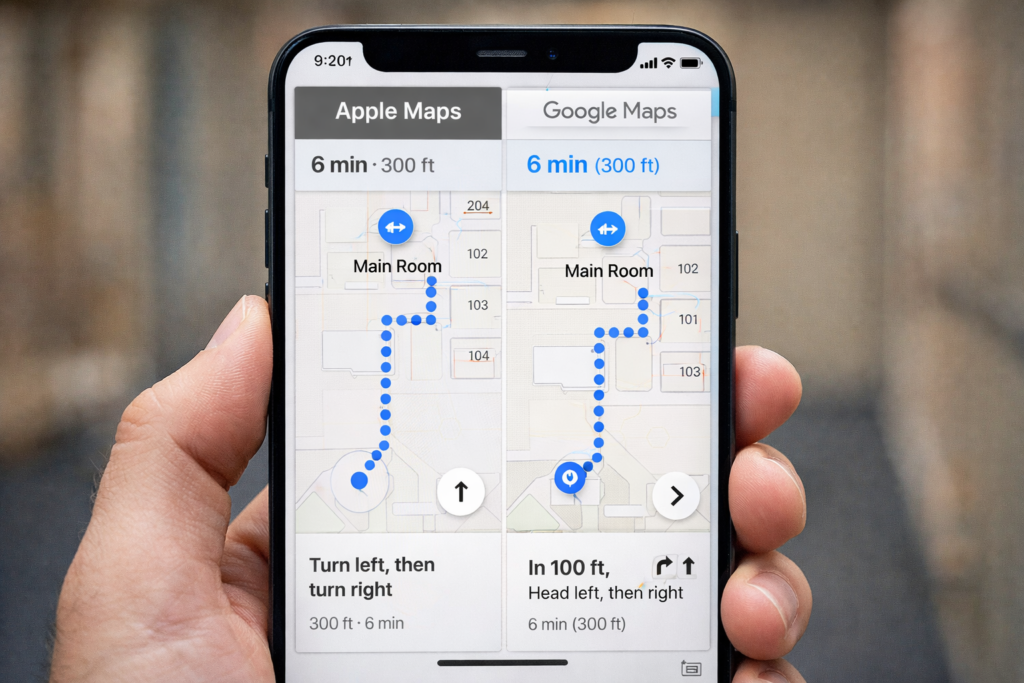
Part 2 — Navigate Between Custom Pins (Apple Maps + Google Maps)
Siri provides indoor headings and distance even when indoor maps do not exist. Google Maps adds strong outdoor accuracy when needed.
A. Navigate to the Main Room (Apple Maps)
Say, “Siri, walking directions to Main Room.”
VoiceOver reads distance and direction.
B. Navigate to the Bathroom (Apple Maps)
Say, “Siri, walking directions to Bathroom.”
Follow hall cues and maintain alignment.
C. Use Google Maps When Outdoors
Say: “Hey Siri, open Google Maps.”
Use VoiceOver to choose Walking.
Follow turn-by-turn directions with outdoor accuracy.
Google Maps excels outdoors. Apple Maps excels for labeled pins indoors.
Part 3 — Teach Compass Skills for Indoor Orientation
A. Open Compass
Say, “Hey Siri, open Compass.”
VoiceOver reads the heading.
B. Teach Basic Directions
North equals 0 degrees.
East equals 90 degrees.
South equals 180 degrees.
West equals 270 degrees.
C. Practice Turning
Face forward.
Listen to the heading.
Turn left or right.
Listen as VoiceOver updates the heading.
D. Connect Compass to Pins
Say, “Siri, walking directions to Bathroom.”
Listen for cues like “Head west.”
Match the heading in Compass.
Walk in that direction.
Part 4 — Build Route Memory Using O&M Skills
A. Notice Landmarks
Teach the traveler to notice:
Floor textures
Temperature changes
Echo patterns
Doorframes
Rails
Open spaces
B. Teach Step Counting
Start at the first labeled pin.
Count steps to the next point.
Stop at each turn.
Record distances.
C. Teach Repetition
Practice with guidance.
Practice with shadowing.
Practice with verbal prompts.
D. Teach Reverse Routing
Walk the route backward using opposite turns.
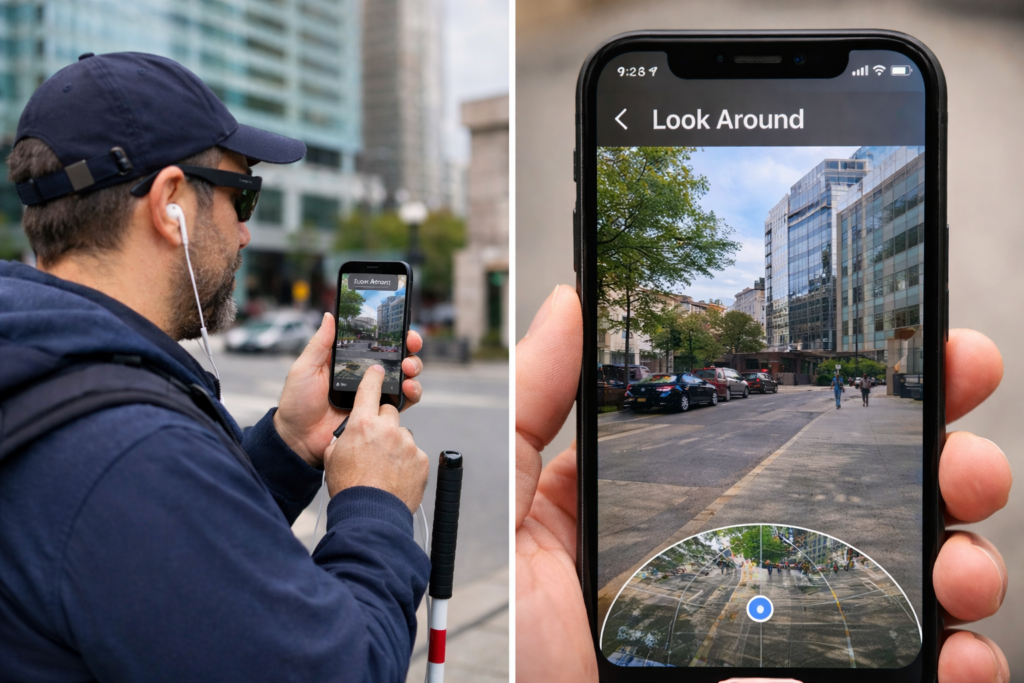
Using Look around app on iPhone to “see” what is around the traveler
Part 5 — Use Look Around with Apple Maps
Look Around helps travelers understand the outside of a building.
A. When Look Around Works
On public streets
At building entrances
Around sidewalks and driveways
B. Open Look Around
Say, “Hey Siri, open Apple Maps.”
Search for the building.
Flick until VoiceOver says “Look Around available.”
Double-tap to open it.
C. What Look Around Teaches
Street layout
Sidewalk positions
Entrance locations
D. What Look Around Cannot Do
No hallways
No interior rooms
No indoor turn-by-turn directions
Create Custom Routes
Part 6 — A Complete Custom Route Routine
Use Look Around outside to understand the area.
Drop labeled pins at important indoor locations.
Use Siri for walking directions to any saved pin.
Use Compass to match the required heading.
Use Google Maps for outdoor paths when needed.
Build step counts and turns for each route.
Use landmarks for confirmation.
Practice until the traveler moves independently.
Share Location, Get Directions, Add to Favorites and more using Google Maps, Voice Over and Siri
Part 7 — Share Your Location Quickly for Pickup or Safety
Blind people often need to share their exact location so family, friends, or rides can find them. Siri and VoiceOver make this process fast and hands-free.
This skill works indoors and outdoors. It also works when someone feels unsafe, confused, or needs help immediately.
A. Share Your Location with Siri (Fastest Method)
Say: “Hey Siri, share my location with Mom.” (Replace “Mom” with any trusted contact.)
Siri sends your exact GPS location.
VoiceOver confirms: “Sent your current location.”
This method works even when you cannot identify where you are.
B. Share Your Location in Messages (Manual Method)
Say: “Hey Siri, open Messages.”
Touch the center of the screen.
Flick right until you hear the contact’s name.
Double-tap to open the conversation.
Flick right until you hear “Send My Current Location.”
Double-tap to send it.
VoiceOver confirms the message.
This method helps when someone prefers not to dictate aloud.
C. Share Your Location Permanently With a Trusted Contact
This helps a helper monitor travel when needed.
Say: “Hey Siri, open Messages.”
Open the trusted contact’s conversation.
Flick to “Details” or “Info.”
Double-tap.
Flick to “Share My Location.”
Double-tap.
Flick to “Share Indefinitely.”
Double-tap to activate.
The trusted person can now find your location anytime you share it.
D. When Lost
Stop walking.
Hold the phone in both hands.
Face a quiet direction.
Say: “Hey Siri, share my location with Mom,” or person.
Wait for VoiceOver to confirm.
Stay in place until person arrives.
E. Combine Location Sharing With Dropped Pins
You can do both:
Drop a pin at the pickup point.
Label it with VoiceOver.
Share their location with Siri so the pickup person receives the exact spot.
Use Compass to stay oriented until they arrive.
This gives the safest and most accurate pickup routine.
Can’t Log in, forgot password: Computer showing errors
Forgotten Passwords & Login Problems
When you can’t log in — whether you forgot your password, never received the code, or your computer refuses to move past the first screen — everything stops. The frustration hits instantly, and it happens to everyone. The good news is that most login problems have simple, safe fixes. This guide walks you through the most effective steps to get back into your accounts, clean up the issues that cause login failures, and set up your devices so you don’t get locked out again — or at least know exactly what to do when a computer update suddenly changes your options. Keep that in mind: the problem may not be you. Sometimes an update quietly shifts the settings behind the scenes, and you just need to adjust to the new way your computer handles logins.
Forgotten Passwords & Login Problems: A Clear, Safe Guide to Getting Back In
People search for this more than almost any other tech issue. You are in Good company. Here’s a simple, accessible guide to help you get back into your accounts — and prevent future lockouts.
Start Easy: Hard Refresh the Page (Ctrl + Shift + R) on a PC and Command + Shift+ R on a Mac
1️.Locked Out of an Account? Start Here
Common symptoms
Password suddenly not working
Reset link not arriving
Multi‑factor authentication (MFA) asking for a code you can’t access
Endless login loops
These problems usually come from:
Browser cache issues
Old passwords stored in auto-fill
Conflicting authentication methods
Out‑of‑date recovery information
2️. Clear Your Browser Cache (This Fixes 50% of Login Problems)
Chrome
Press Ctrl + Shift + Delete
Choose Cached images and files
Click Clear data
Edge
Press Ctrl + Shift + Delete
Select Cached images and files
Click Clear now
Firefox
Press Ctrl + Shift + Delete
Select Cache
Click Clear
This removes corrupted login data and forces the site to load fresh.
Also Check Your Saved Passwords (Old Ones Cause Login Failures Too-delete them!)
After you clear your cache, take one more quick step: open your browser’s saved passwords and delete the outdated ones. Old passwords often override the new ones you type, which creates endless login loops.
Chrome
Press Alt + E to open the menu
Press S to jump to Settings
Select Auto-fill and Passwords
Open Google Password Manager
Search for the site you’re trying to log into
Delete any old or duplicate passwords
Edge
Press Alt + F to open the menu
Press S for Settings
Select Profiles
Choose Passwords
Search for the website
Delete outdated or incorrect entries
Firefox
Select Settings
Choose Privacy & Security
Scroll to Logins and Passwords
Open Saved Logins
Remove old or incorrect passwords
Why this matters
Browsers love to “help” by auto-filling passwords — even when they’re wrong. When you delete the old ones:
Your new password works correctly
The login screen stops looping
The reset process finally sticks
You avoid the “I know I typed it right!” frustration
3️. When You Set Up a Password — ALWAYS Connect It to Your Phone
This is the single most important step for preventing lockouts.
Set up the same password manager on your computer to pair with phone
Why?
Your phone becomes your identity key. If you forget your password, the system can verify you instantly.
You can also quickly go into your password manager and look up the password you need for any site on your computer.
Set Up the Same Password Manager on Your Phone and Computer
Using the same password manager on both devices keeps everything synced. When you update a password on your phone, it instantly updates on your computer — and that prevents almost every future lockout. And remember, you don’t have to use the password manager every time you log in. As you create accounts, save your usernames and passwords in your browser so you can keep logging in the same easy way you always have. The password manager simply becomes your reliable backup when something goes wrong.
Below are simple, universal steps that work for any major password manager (Microsoft Authenticator, Bitwarden, 1Password, etc.).
Step 1: Install the Password Manager on Your Phone
Open the App Store (iPhone) or Google Play Store (Android).
Search for your chosen password manager.
Tap Install.
Open the app and sign in or create an account.
Turn on sync if the app asks (most do automatically).
Your phone now becomes your secure “master key.”
Step 2: Install the Same Password Manager on Your Computer
Open your browser
Go to the password manager’s official website.
Download the desktop app or browser extension.
Sign in with the same account you used on your phone.
This pairs your computer and phone instantly.
Step 3: Turn On Sync Between Device
Most password managers sync automatically, but here’s how to confirm:
Open the password manager on your phone.
Go to Settings.
Look for Sync, Cloud Sync, or Account Sync.
Make sure it’s turned ON.
Now every password you save on one device appears on the other.
Step 4: Import or Save Your Password
You can now:
Save new passwords directly into the manager
Import passwords from your browser
Update old passwords and let the manager store them–This ensures you never rely on outdated browser auto-fill again.
Step 5: Choose How you want to Log in: Password Manager or From Browser
Option A: Keep using your browser’s saved passwords
This is the fastest way to log in day‑to‑day. Your browser auto-fills your username and password, and you move on with your work.
Option B: Use the password manager when needed
If something breaks —
a password doesn’t work
a browser update wipes your autofill
a site forces a reset — you can open your password manager and instantly look up the correct username and password.
This is the key detail: Your password manager acts as your backup vault, so you never lose access even if your browser forgets or changes something.
Why This Matters
When your phone and computer share the same password manager:
You always have the correct password stored somewhere safe
You can keep using your browser for fast logins
You avoid lockouts caused by old autofill entries
You stay in control even when updates change things
It’s the perfect balance of speed and security.
4️.Choose ONE Authentication Method (Not All of Them)
Using multiple authenticators confuses systems and causes login loops.
Here are the three main types, with simple visuals you can describe to your audience:
🔵 Option 1: Text Message (SMS)
Visual: A phone with a speech bubble containing a 6‑digit code. Best for: Beginners Pros: Easy, no app needed Cons: Not as secure as app‑based codes
🟢 Option 2: Authenticator App (Microsoft Authenticator, Google Authenticator, Duo)
Visual: A shield icon with a rotating 6‑digit code. Best for: Most users Pros: Fast, secure, works offline Cons: Must be installed on your phone
🟣 Option 3: Email Verification
Visual: An envelope with a key inside. Best for: People who check email constantly Pros: Simple Cons: Slow, sometimes goes to spam
5️. Windows Login Problems: Safe Steps You Can Do
Sometimes Windows won’t let you log in because of:
A stuck update
A corrupted profile
A password mismatch
A login option that’s blocking access (PIN, fingerprint, picture password)
Use SHIFT + RESTART to Access Windows Recovery Options
This is the only safe, built‑in way to reach troubleshooting tools.
Steps
On the login screen, click the Power icon (bottom right).
Hold SHIFT on your keyboard.
While holding SHIFT, click Restart.
Windows will open the Advanced Startup Menu.
From here, you can safely access:
✔ Startup Repair
Fixes boot issues.
✔ Safe Mode
Lets you log in with minimal drivers.
✔ Command Prompt
For advanced repairs (not needed for most users).
✔ Reset Password (Microsoft Account)
If you use a Microsoft account, you can reset it from here.
6️. Prevent Future Lockouts: Use a Password Manager on Your Phone
This is the long‑term solution that saves people from ever being locked out again.
Recommended password managers:
Microsoft Authenticator (has password storage built in)
Bitwarden (free, secure, cross‑platform)
1Password (paid, excellent for families)
Google Password App
LastPass (popular, but had past breaches — use with caution)
Why store passwords on your phone?
Your phone is always with you
You can look up usernames and passwords instantly
Syncs with your computer
Works even if your computer won’t turn on
You’re not alone — login problems happen to everyone. With these steps in place, you’ll stay in control and avoid the frustration of being locked out again.
Calibre’s Windows download page offers a powerful, free tool for managing digital books across platforms, making it an excellent choice for tasks like using Calibre-translate EPUB to DOCX format. Whether you need to translate epub files to docs or other formats, Calibre is compatible with Windows 10 (version 1809 and above) and is a one-stop solution for digital management, of e-book conversion, library organization, and device syncing. Key features include:
Multi-format support: Convert between EPUB, MOBI, PDF, and more, including Calibre-translate EPUB to DOCX
Device syncing: Seamlessly transfers books to Braille displays and screen reader-compatible devices
Customizable interface: Works well with JAWS, NVDA, and other assistive technologies, ensuring easy use when you translate EPUB to docs using Calibre
Legacy support: Older versions available for Windows 7, 8, and early Windows 10 builds
Whether you’re a blind reader using a Braille display or an educator curating accessible content, Calibre empowers users to take control of their digital libraries with clarity and ease. It especially excels in tasks like Calibre-translate EPUB to DOCX. Please remember to contribute to their great efforts in making life easier, especially with tools like Calibre-translate EPUB to DOCX
FOR the Blind-VI, Transcribers, etc. learning to your needs
Professional development for teachers and other personnel is generally designed for the broader teaching community. However, teachers of the blind and visually impaired can request specialized instruction on these days. TechVision offers tailored learning experiences for teaching and learning with screen readers, braille displays, and other access technology. With TechVision, educators can acquire the specific skills needed to help their students learn and access education. This Professional Development for Teachers allows their students to be on the same level as their peers over time. It also helps teachers develop tech competencies for the year. Specialized professional development helps to guide and ensure that all students, regardless of their visual abilities, can compete on an equal footing with their sighted peers.
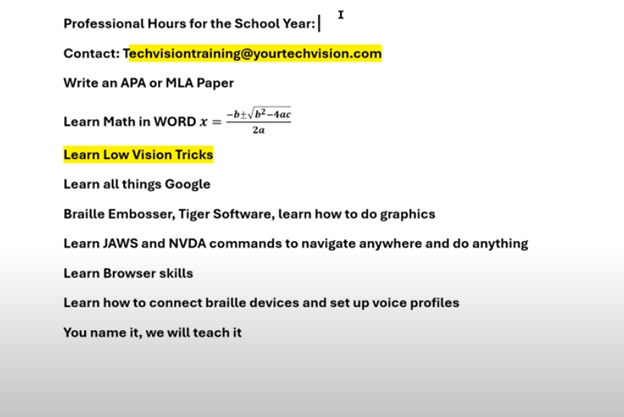
It’s that time of year when everyone signs up for professional hours. You can join the Regular Pack, but if you need something specific for teachers of the blind, TechVision offers specialized instruction. Learn how to teach students and develop your own skills, including transcriber skills. Professional Development for Teachers often includes learning how to deal with specialized educational needs. Contact TechVision Training to learn like our students who use screen readers.
Learn math, low vision tricks, and screen reader commands. Learn all things Google, braille embossers, and Tiger software. Master JAWS or NVDA commands, browser skills, and voice profiles. We teach everything, from box and whiskers in Excel or Google to formatting APA and MLA papers in Google Docs or Word. Learn PowerPoint or Google Slides, making them accessible and visually appealing. We offer professional development throughout the year, including one-on-one or group sessions. This ensures that during big professional development days, you are already well-prepared for exactly what you need to learn. TechVision provides another avenue to learn the skills necessary to teach your students effectively with Professional Development for Teachers. Let us know if we can help: TechVisiontraining@yourtechvision.com. In the meantime, improve the speed of your computer.
Professional hours list and you add what you need
Professional Development Opportunities for Teachers and More
Keith Bundy, a blind baseball announcer, shared his journey of overcoming obstacles to live his dream as a sports announcer. Mr. Bundy, blind since childhood, longed to play sports but lacked opportunities in Southern Indiana. Listening to baseball broadcasts fueled his dream. In 2001, he received an invitation to announce an American Legion Baseball game. With family support and a refreshable braille display, Bundy began announcing for teams semi-professionally.
On August 29th and 30th, significant events took place in Madison, South Dakota. The Dakota State University Trojans and the Madison Bulldogs both won their first games in their new stadiums. However, a less noticed but equally significant event occurred on August 29th. Keith Bundy, who grew up blind in Southern Indiana, fulfilled a lifelong dream by becoming an announcer in stadiums. It was a monumental day for Blind Baseball Announcer Keith Bundy.
Growing up, Keith was passionate about sports but couldn’t participate due to his blindness. He spent many nights listening to baseball broadcasts and dreaming of being part of a team. In 2001, a chance opportunity to announce an American Legion Baseball game changed his life. With the support of his family and the use of assistive technology like a refreshable braille display, Keith began announcing baseball games. Over the years, he announced for various teams, including Dakota State University and the Madison Broncos.
Blind baseball announcer Keith reading stats from braille display
Keith is FIRST person to in new stadium
On August 29th, Keith became the first person to announce an event in the new stadium, a moment he described as humbling and significant. He emphasized that blindness is not an insurmountable obstacle and credited his success to the right circumstances, a strong work ethic, and the support of many people, including his wife Peggy and his friend Tom Frel. Blind Baseball Announcer Keith Bundy has shown that anything is possible with the right support.
Keith’s story is a testament to perseverance and proper education. Most of all, the power of community support in achieving one’s dreams.
Blind individuals, with the right instruction and tools, can achieve their dreams just like anyone else. By learning essential skills, such as using assistive technology, braille, or orientation and mobility training, they can overcome obstacles that once seemed insurmountable. With guidance tailored to their needs, they gain confidence, independence, and the ability to pursue passions, whether in academics, sports, or careers. By embracing the right resources and support, blind people can turn their dreams into reality and thrive in any field they choose.
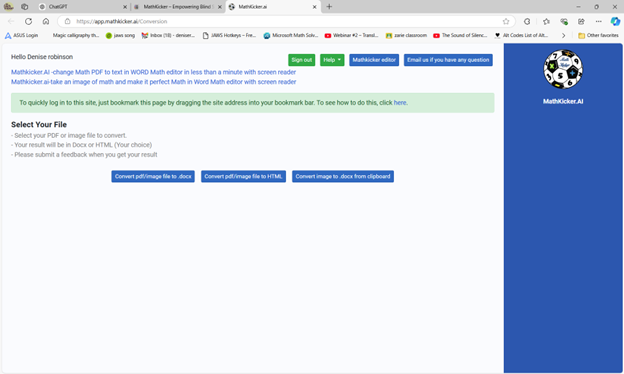
More options for JUST auditory learners or braille learners and taking totally inaccessible images of WORD and making them accessible using Mathkicker.AI.