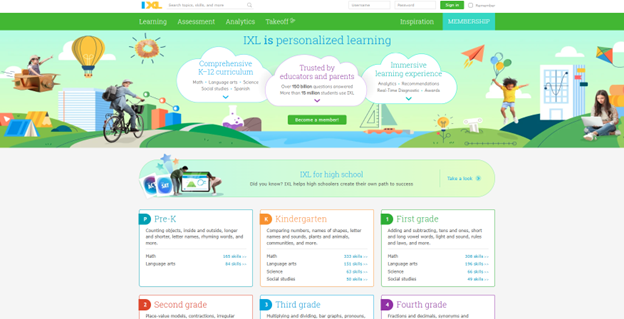
Search results for: “WORD”

  • Connect Focus 40 braille display to Jaws

    Connecting a Focus Braille Display to a computer using JAWS screen reader enhances accessibility for blind and visually impaired users. The process of connecting a Connect Focus 40 Braille display allows users to interact with digital content through tactile feedback, improving independence and productivity. By following a few simple steps, you can seamlessly connect the Braille display via USB or Bluetooth and configure it in JAWS for optimal use. This guide provides an easy-to-follow approach for setting up your Focus Braille Display and ensuring smooth integration with JAWS.

    Here are the steps to connect a Focus Braille Display to your computer using JAWS screen reader:

    Connect Focus 40 Braille Display or other displays

    1. Power on the Focus Braille Display

    Ensure the Focus Braille Display is fully charged and powered on before connecting.

    1. Connect the Display to the Computer

    Use either USB or Bluetooth to connect the Focus Braille Display to your computer.

    For USB: Plug the USB cable into both the Braille display and the computer.

    For Bluetooth: Enable your computer’s Bluetooth and pair the Focus display in the Bluetooth settings.

    1. Enable Braille in JAWS

    Open JAWS by pressing Insert + J. Then, press Alt + O to open the Options menu.

    Press B to select Braille or use the arrow keys to navigate, then press Enter.

    1. Select the Braille Display

    In the Braille settings window, ensure the “Focus” display is selected under the Default Braille Display dropdown.

    If it’s not selected, use the arrow keys to choose “Focus” or manually type the model of the Braille display.

    1. Check Braille Display Connection

    After selecting the correct display, click OK or press Enter to confirm the connection.

    JAWS should now detect the Focus Braille Display. Braille output should appear, and the display keys will control JAWS.

    1. Configure Settings (Optional)

    To further customize settings like verbosity and Braille output, go to Braille options via Insert + J, Alt + O, and B.

    1. Test the Connection

    Use JAWS commands on your keyboard or the Focus Braille Display keys to navigate.

    If the connection works, the Braille display will respond to the text output from the computer.

    By following these steps, you should successfully connect your Focus Braille Display to a computer using JAWS.

    Braille Display and Other Lessons

    Quadratic Formulas with UEB Math or Nemeth and/or display with JAWS audio & MathCat

    Complete Advanced Math with LaTex to finish math fast using Mathkicker.AI, JAWS, NVDA and/or display

    Transcribe Math into Word documents for blind students using Math editor, Jaws and a Braille Display

    Track Changes with Commands-inserting comments and editing work

    Essential WORD keyboard commands for setting defaults

    Excel line plot graph-copy to Word for Math

    Complete an excel graph and copy into Word document with screen reader

    Basic WORD JAWS commands with Typing Trick

    Rebuild Microsoft Word Template when it is not working well

    Other Focus Display lessons

  • Excel for Geometry: Create Shapes and Label Graphs with JAWS

    Using Excel for geometry tasks, such as inserting shapes and labeling graphs, can be highly effective, especially for visually impaired students. By leveraging keyboard commands, students can efficiently navigate through Excel’s features. For instance, pressing Alt + N opens the Insert tab, and SH brings up the Shapes menu, allowing users to select and draw shapes. To label a graph, students can use Alt + JC to access the Chart Tools Design tab, followed by A to add chart elements like data labels and titles. These steps not only enhance the learning experience but also demonstrate the power of assistive technology in making complex tasks accessible and manageable

    Start at the top of A1 and start adding data in both A and B. Make sure you add a space between you 2 Geometric shapes so they can mirror each other or whatever the assignment requires.

    Here are other options for Geometry shapes

    Here’s how you can insert shapes and label a graph in Excel using keyboard commands:

    Geometry: create Shapes and label graphs
    Geometry: create Shapes and label graphs

    Excel for Geometry: Create Shapes and Label Graph

    Inserting Shapes

    1. Open Excel and navigate to the worksheet where you want to insert shapes.
    2. Press Alt to activate the ribbon shortcuts.
    3. Press N to go to the Insert tab.
    4. Press SH to open the Shapes menu.
    5. Use the arrow keys to select the shape you want, then press Enter.
    6. Click and drag (or use arrow keys) to draw the shape on your worksheet.

    Labeling a Graph

    1. Select your chart by pressing Ctrl + Arrow keys to navigate to it.
    2. Press Alt to activate the ribbon shortcuts.
    3. Press JC to go to the Chart Tools Design tab.
    4. Press A to open the Add Chart Element menu.
    5. Press D to select Data Labels, then choose the desired position using the arrow keys and press Enter.

    Adding a Chart Title to Excel for Geometry

    1. Select your chart.
    2. Press Alt to activate the ribbon shortcuts.
    3. Press JC to go to the Chart Tools Design tab.
    4. Press A to open the Add Chart Element menu.
    5. Press T to add a chart title, then type your title and press Enter.

    These steps should help you efficiently create Shapes and label graphs in Excel using keyboard commands. If you need more detailed instructions or have any specific questions, feel free to ask!

    Other Excel Lessons

    Another Student Mastering Excel with PPT integration

    Create a Histogram

    Scatter plot with trendline

    Excel line plot graph-copy to Word for Math

    Complete an excel graph and copy into Word document with screen reader

    If your fingers need to see multiple lines on your display, then this lesson will help

  • Desmos Graphing Calculator Solution for Blind and Low Vision

    In this Video lesson, Dr. Denise Robinson demonstrates the Desmos calculator, an online tool used in schools for graphing solution for even Geometry. She highlights its fun and accessible nature, noting that while she can’t cover all its features in 1 video, she will guide through the basics of using the Desmos.

    First, she instructs users to press Control + O for 1 option for a new graph. Using JAWS screen reader. But any screen reader will work. After pressing Control + O, users hit Enter to create a new blank graph. They can navigate through options using the down arrow also for many other types of graphs. Dr. Robinson then guides users to type in formulas to create parabolas and lines, making use of various functionalities in the Desmos Graphing Calculator Solution.

    Visual Calculator and PC Calculator for Desmos Graphing Calculator Solution

    A keyboard appears at the bottom of the screen, which is manageable for low vision children. For low vision children, she recommends using Control + Plus to zoom in, allowing them to adjust the size as needed. Control + Zero returns the display to normal size. Blind students will use the PC built in calculator for full access, ensuring the best use of the Desmos Graphing Calculator Solution.

    Desmos graphing solutions- picture of parabola and formulas
    Desmos Calculator Graphing Solutions- picture of parabola and formulas

    Next, Dr. Robinson explains how to open the field dialogues or share or export to emboss a graph by pressing Insert + F5. She mentions Desmos works well in Chrome, Edge and sometimes in Firefox based on updates. She advises users to label their graph. Insert + F5 also assists in many other JAWS screen reader functionalities, enhancing the use of the Desmos Graphing Calculator Solution.

    Dr. Robinson then demonstrates typing formulas, such as X superscript 2 minus 1/2. She shows how the graph forms visually and explains using Shift + 6 for superscript. Users can listen to the graph’s details by using H and the arrow keys, with the right arrow moving right and the left arrow moving left, providing detailed information about the graph’s points. Desmos Keyboard Shortcuts and other Math Lessons further elaborate on how to effectively use the Desmos Graphing Calculator Solution.

    Find more with Desmos:

    Desmos 3D graphing

    for Geometry in Desmos

    for STEM and Embossing in Desmos

    Desmos and inserting graphs into Math Work in WORD

    Creating shaded Parabolas in Desmos

    Games with Desmos with Drag and Drop

  • Focus Display Navigation options

    Dr. Robinson demonstrates how to navigate with the Focus 40 Braille Display, highlighting various commands and features for efficient use. She introduces the Focus 40 Braille Display, explains the importance of navigation commands, and demonstrates various navigation techniques. Additionally, she covers Focus Display Navigation Options to help users maximize their efficiency.

    Focus Display Navigation Options Video Highlights

    • Introduction to navigation
      • Dr. Robinson introduces the Focus 40 Braille Display.
      • Explains the importance of navigation commands.
      • Prepares to demonstrate various navigation techniques.
    • Basic navigation commands
      • Shows how to move to the top and bottom of the display.
      • Uses specific key combinations for navigation:
        • Move to Bottom: Press dots 4-5-6 + Space.
        • Move to Top: Press dots 1-2-3 + Space.
      • Emphasizes the logic behind the commands.
    • Line and word navigation
      • Demonstrates moving one line at a time.
      • Uses key combinations for precise movement:
        • Move Down One Line: Press dot 4 + Space.
        • Move Up One Line: Press dot 1 + Space.
      • Explains how to navigate by words:
        • Move Forward One Word: Press dot 5 + Space.
        • Move Back One Word: Press dot 2 + Space.

    Other Display Navigation

    Focus braille display navigation options using router key
    Focus Braille Display navigation options using router keys
    • Router keys and mode buttons
      • Highlights the use of router keys for quick cursor movement.
      • Introduces mode buttons for different navigation options:
        • Router Keys: Press the router key above the desired character.
        • Mode Buttons: Located on the left and right sides.
      • Shows how to navigate by paragraphs and sentences:
        • Move Forward One Paragraph: Press the right rocker switch down.
        • Move Back One Paragraph: Press the right rocker switch up.
        • Move Forward One Sentence: Press the left rocker switch down.
        • Move Back One Sentence: Press the left rocker switch up.
    • Panning and rocker switches
      • Explains the function of panning buttons:
        • Move Forward One Display Width: Press the right panning button.
        • Move Back One Display Width: Press the left panning button.
      • Demonstrates the use of rocker switches for line navigation:
        • Move Up One Line: Press the right rocker switch up.
        • Move Down One Line: Press the right rocker switch down.
      • Highlights the benefits for sighted individuals working with Braille learners.

    Benefits of Focus Display

    The Focus 40 Braille Display offers numerous benefits. Firstly, it enhances Braille literacy through intuitive navigation commands. Additionally, its versatile features support efficient reading and writing. Moreover, students can easily move through text, improving their skills. The Focus Display can be used exclusively to control the computer–that means, you DO NOT need to use the keyboard if you cannot or do not want to. This makes for VERY efficient math calculations. The device’s compatibility with various screen readers ensures accessibility. Furthermore, its portability allows seamless use in different environments. Overall, the Focus 40 empowers users, boosting their independence and confidence in learning.

    Options for going between the display to take notes and the computer give many more options also

  • Switch Focus Braille Display Modes Quickly

    Dr. Robinson explains the three toggles to Switch Focus Braille Modes quickly on your Braille display. One toggle puts you into Braille mode for all Braille tasks. Another toggle switches to computer braille which inputs direct Nemeth code for math. The third toggle is for computer in and contracted out for either Nemeth or UEB math.

    Access Jaws settings to set up Focus Braille Mode Options

    First, press Insert + 6 to check your settings. Type “braille m” and down arrow to “Braille mode.” You can access options one by one with arrow keys or press F6 to jump to structured then Alt+T to jump to output. Press down arrow to UEB Grade 2 then tab to input and c to computer braille first to uncheck the box that says “Show current word in computer Braille”. Shift tab back up to input and choose UEB for both input and output. You can have other options also but this is what used here.

    Tab through back to For structured Braille mode, check “Active cursor follows Braille cursor” and “Braille cursor follows active cursor.” These settings help beginners, especially when working with sighted personnel learning Braille to following along visually for instructor. Always have a certified Braille instructor (TVI) to teach reading and writing Braille correctly.

    Always press Alt + A to apply settings before exiting. However, if you do not like the extra information at the start of your display, shift tab back to search in settings and type status and enter. Down arrow to status and F6 and down to right (to place status on the right of display) and down to none and apply that and close. When you first turn on your Braille display, the status characters may be confusing to young learners. Additional Braille Display Lessons here.

    Focus Braille Display Image with Button options

    switch Focus display modes quickly on display
    Switch Focus Braille display modes quickly on display

    For advanced users, status dots help in tables and other navigation. Beginners should start with “none.” Press Alt + A to apply changes, then enter to close. The Braille display functions like a Braille writer. Keys 1 2 3 are on the left, and keys 4 5 6 are on the right with space in between the left and right side. The left pinky key is backspace, which changes to dot 7, and the right pinky is enter or dot 8 in combination with other keys.

    More Videos Lessons

  • Mission and Purpose

    Mission and Purpose of TechVision using braille display, keyboard and iPhone for who we are and what we do
    Picture of braille display, keyboard and iPhone for who we are and what we do

    Our Mission

    TechVision’s mission and purpose is to empower blind and visually impaired students through personalized, real‑time instruction in assistive technology, braille, STEM, and essential academic skills. Led by Dr. Denise M. Robinson, our specialists teach the tools and strategies students need to access information, build independence, and compete equally with their sighted peers.

    What We Do

    TechVision provides 1:1 remote instruction for learners of all ages. Our team teaches and offers:

    What others use only through access methods such as but not limited to:

    • AI‑supported learning strategies:
      This direct, individualized approach transforms how blind and low‑vision students learn, work, access and navigate the world, staying true to our mission and purpose.
    • Screen readers
    • Braille displays
    • Computers and mobile devices
    • Word processing and productivity tools such as embossing
    • All academic classes and especially: Math, STEM, Nemeth, and all literacy
    • We provide rapid transcription services with quick digital turnaround, often within one hour when needed, and teach students how to independently emboss their own work.
    • We team with a certified Orientation & Mobility (O&M) specialist -Kevin Hollinger of Blindnesspro.com who travels on-site to deliver intensive instruction in safe, independent travel. Training includes school navigation, community routes, and real-world mobility skills to support full independence.

    Why Our Work Matters

    TechVision also trains school personnel: including transcribers, Teachers of the Blind, Teachers and support staff, to ensure students receive consistent, accessible materials. We partner with districts, families, and private organizations to create inclusive environments where blind and visually impaired individuals can thrive, fulfilling our mission and purpose.

    Mission and Purpose Designed for Every Learner

    We teach learners of all ages. Every student receives customized instruction based on their goals, strengths, and needs. Whether developing early childhood skills, mastering advanced mathematics, learning to use a braille display, preparing for college and employment, or adapting to vision loss later in life, our instruction meets each learner exactly where they are. Many of our students go on to pursue STEM fields, including Applied Mathematics at top universities.

    Free Learning on YouTube Channel and YourTechvision.com

    The TechVision YouTube channel, created by Dr. Denise M. Robinson and her Team, offers hundreds of free, accessible video lessons. These lessons focus on empowering individuals who are blind or visually impaired through technology education. The channel covers a wide range of topics, making it useful for students, educators, and parents.

    Each video provides hands-on, step-by-step tutorials for using assistive technology. Viewers can learn to use screen readers, magnification tools, and braille displays. The lessons also include detailed instructions on using programs like Microsoft Office and Google applications. This practical approach helps users apply technology to real-world tasks.

    See What Is Possible with 21st Century Assistive Technology Instruction

    These short clips show how quickly students build independence and speed through advanced assistive technology training delivered by instructors who use these tools daily in real-world application.

    Contact Us

    We are here to help you succeed.

    Let us know how we can help you: Contact US: TechVisionTraining@yourtechvision.com

  • Make an Electronic Signature — Then Insert It into a Document

    You can quickly create an electronic signature using keyboard commands on various platforms. In Microsoft Word or Adobe Acrobat, type, draw, or insert a signature image. Keyboard shortcuts simplify the process, making it easy to add signatures to digital documents. This guide provides step-by-step instructions on typing, drawing, or inserting a signature using shortcuts. You can apply this method across all versions of Word for creating electronic signatures efficiently and effectively.

    To create an electronic signature using keyboard commands, follow these steps:

    Make Electronic Signatures in WORD and Adobe

    1. In Microsoft Word:
    • Open a blank document. Press Alt + N, then P to insert a picture if you’re using a scanned image of your signature.
      • This means, hand write out a signature and scan it into computer and save as your signature. Then insert that into your documents and use any where to make an electronic signature process smoother
      • Use a mouse to crop out JUST the signature, application key when you are on the image and save as picture and name it the word signature after your name
    • For typed signatures, press Ctrl + Shift + K to enter text in a signature-like font (if available), then press Ctrl + B to bold the text if needed.
    • To save the signature, press Alt + F, then A to save as a PDF or document.
    Practice making an electronic signature using the name 'Jane Doe
    Practice making an electronic signature using the name ‘Jane Doe
    1. In Adobe Acrobat:
    • Open a PDF and press F6 to navigate the newest Adobe or Alt + T for the tools menu. Navigate with F6 or the arrow keys to “Fill & Sign” and press Enter. Follow prompts to either type, draw, or insert an image of your signature.

    Any issues in WORD, then just rebuild it

    Other access Lessons on YOUTUBE

  • Excel Histogram with Keyboard Commands

    Creating a histogram in Excel using keyboard commands makes data analysis quick and efficient. First, select your data with Shift + Arrow Keys. Then, insert the chart using Alt + N, followed by H to choose a histogram. This process allows you to visualize data distributions without a mouse, making it both accessible and streamlined. By using these simple commands, you can create effective histograms in just a few steps.

    To create a graph in Excel using keyboard commands:

    1. Select Data: Highlight the data using Shift + Arrow Keys.
    2. Insert Chart: Press Alt + N to open the Insert tab.
    3. Open Histogram Option: Press H to select the Histogram option from the Charts menu.
    4. Choose Histogram: Use Arrow Keys to navigate and press Enter to insert the histogram.

    Now you have a histogram using just the keyboard.

    Excel Histogram with keyboard commands
    Excel Histogram with keyboard commands

    When you finish, you can move data into DESMOS and emboss the graph

    Solving inequalities

    Create Histogram

    Excel Trendline with Scatter Plot

    Other Excel Lessons that you can do in Sheets

    Flashcard Study in Sheets

    Increase your Technology knowledge via more lessons

  • Excel Quadratic Trendline with Scatter Plot Graph Including Equation Using JAWS

    A quadratic trendline with a scatter plot shows the relationship between two sets of data that form a curved pattern. Instead of a straight line, it fits a U-shaped or upside-down U-shaped curve, helping to see trends when data increases or decreases at different rates. Using an Excel Quadratic Trendline with scatter plot makes it useful for predicting changes that don’t happen in a straight line, like acceleration or deceleration. The equation on the graph helps explain this relationship and can be used for future predictions.

    Using keyboard commands in Excel, combined with JAWS screen reader, makes it possible to create a quadratic trendline on a scatter plot while also displaying the equation. This process is essential for visually impaired users who need accessible methods to perform complex data analysis. By using commands like Alt + N + S to insert the scatter plot and Alt + J + F to add the quadratic trendline and display the equation, you can efficiently work with Excel’s graphing tools while maintaining full accessibility with JAWS.

    Excel Quadratic Trendline with scatter plot Keyboard commands

    Excel Quadratic Trendline with scatter plot
    Excel Quadratic Trendline with scatter plot

    Here are the keyboard commands to add a quadratic trendline with a scatter plot and display the equation in Excel using JAWS:

    1. Create Scatter Plot:
    • Select data with Shift + Arrow Keys.
    • Press Alt + N, then S to insert a scatter plot.
    1. Add Quadratic Trendline:
    • Select the graph with Arrow Keys.
    • Press Alt + J + F, then A for chart options.
    • Press T to add a trendline, then press Q for polynomial (quadratic).
    1. Show Equation:
    • Press Alt + J + F, then T to show the trendline equation on the chart.

    These steps work seamlessly with JAWS for accessible chart creation. Learn more Excel graphing

    Solving inequalities

    Create Histogram

    Excel Trendline with Scatter Plot

    Other Excel Lessons that you can do in Sheets

    Flashcard Study

    Other Tech Lessons for more skills

  • Save a Google Doc as Plain Text Using Keyboard Commands

    Google offers several tools to make inaccessible images of work accessible through translation and text extraction. Google Translate includes an image translation feature, where users can upload an image and the tool will detect and translate the text within it into another language. Additionally, Google Drive and Google Docs use Optical Character Recognition (OCR) to convert images, like scanned PDFs, into editable text. This makes visual content, such as images with embedded text, accessible for screen readers, helping blind or low vision users engage with the content more easily. Using Google Docs as plain text can further streamline this process.

    Here’s how to save a Google Doc as plain text using keyboard commands:

    1. Open your document.
    2. Press Alt + Shift + F to open the “File” menu. (Many times you can just use Alt+F)
    3. Press Down Arrow to navigate to Download.
    4. Press Right Arrow to expand the options, then press Down Arrow to select Plain Text (.txt).
    5. Press Enter to download the document as a plain text file.
    6. Open the .txt file, select with CTRL + A, Copy it with CTRL+C and paste into WORD with CTRL+ V

    These steps will extract text then download the document with no formatting, leaving only the raw text. Then transfer it into WORD for easy reading

    Google Doc as Plain Text Using Keyboard due to doc being side ways image
    Google Doc as Plain Text Using Keyboard due to doc being side ways image

    More Tech Lessons here and more on adapting work