Before you begin, remember when you are using your devices to maintain upright posture to protect your spine and neck. So, regularly cleaning the Focus 40 Braille Display and running diagnostics is crucial for maintaining its performance and longevity. Dust, dirt, and oils from your hands can accumulate on the Braille cells, potentially causing malfunctions or reducing the tactile quality of the display. By keeping the Braille cells clean, you ensure that the device remains responsive and accurate. Running diagnostics helps identify any issues early, allowing for timely repairs and preventing more significant problems down the line. This proactive maintenance not only extends the life of your device but also ensures a reliable and efficient user experience12.
Here are the steps to clean the Focus 40 Braille Display and run diagnostics:
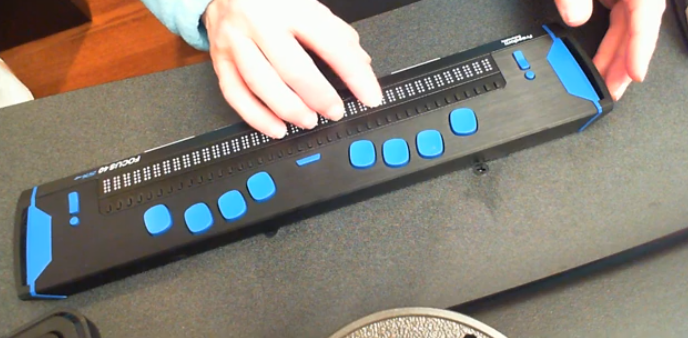
Cleaning the Focus 40 Braille Display
- Turn Off the Device: Ensure the Focus 40 Braille Display is turned off and unplugged.
- Prepare Cleaning Materials: Use a soft, lint-free cloth dampened with water or isopropyl alcohol. Avoid using harsh chemicals.
- Clean the Braille Cells: Hold the device upside down or at a downward angle. Gently wipe the raised Braille dots with the dampened cloth, ensuring all dots are cleaned. Use as much of the cloth’s surface area as necessary to avoid spreading dirt1.
- Dry the Device: Allow the device to air dry completely before turning it back on.
- Try it out and if you need training on reading as fast as you can on the display, let us know.
Running Diagnostics
- Turn On the Device: Power on the Focus 40 Braille Display.
- Enter Diagnostic Mode: Press and hold the
Menubutton while turning on the device. Continue holding the button until the device enters diagnostic mode. - Run Tests: Use the navigation keys to select and run various diagnostic tests, such as checking the Braille cells, buttons, and connectivity.
- Review Results: Follow the on-screen instructions provided by the diagnostic mode to review the results and identify any issues2.
Regular cleaning and diagnostics help maintain the performance and longevity of your Focus 40 Braille Display, ensuring it remains responsive and reliable.
Here is a video to demonstrate braille reading speed