Creating a histogram in Excel using keyboard commands makes data analysis quick and efficient. First, select your data with Shift + Arrow Keys. Then, insert the chart using Alt + N, followed by H to choose a histogram. This process allows you to visualize data distributions without a mouse, making it both accessible and streamlined. By using these simple commands, you can create effective histograms in just a few steps.
To create a graph in Excel using keyboard commands:
Select Data: Highlight the data using Shift + Arrow Keys.
Insert Chart: Press Alt + N to open the Insert tab.
Open Histogram Option: Press H to select the Histogram option from the Charts menu.
Choose Histogram: Use Arrow Keys to navigate and press Enter to insert the histogram.
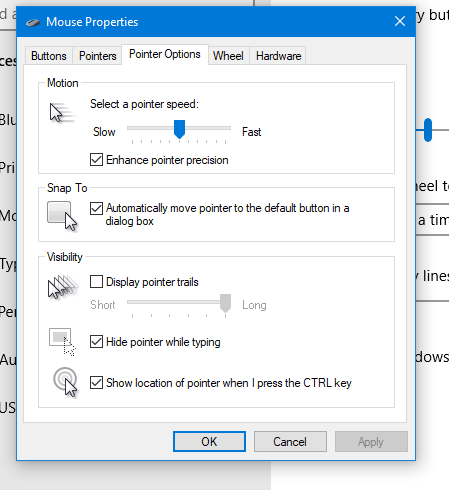
Using keyboard commands to quickly access and adjust mouse settings allows for efficient changes to mouse size and behavior, such as “Snap To” functions. These options are accessible through the Mouse Properties window in Windows, which you can open by pressing Windows + R and typing main.cpl. Once inside, you can navigate tabs and options using Ctrl + Tab and arrow keys, adjusting the mouse size or enabling the “Snap To” feature. This provides an easier and faster way to customize your mouse for improved accessibility and functionality.
To quickly change mouse settings in Windows, use keyboard commands to access Mouse Properties: Another way
Open Mouse Properties: Press Windows and type Mouse then press Enter.
Tab to additional mouse options and enter
Ctrl + Tab to Pointers and Change Mouse Size: arrow to inverted large or extra large based on need
Navigate to the Pointer Options using Ctrl + Tab, then press Tab to “Snap To” or ALT + U to check box
Then press Alt + S to check “Show location of pointer when I press the CTRL key.”
Apply Changes: Press Alt + A to apply the settings and enter to close the window.
Commands to change mouse
These steps streamline navigation without relying on the mouse.
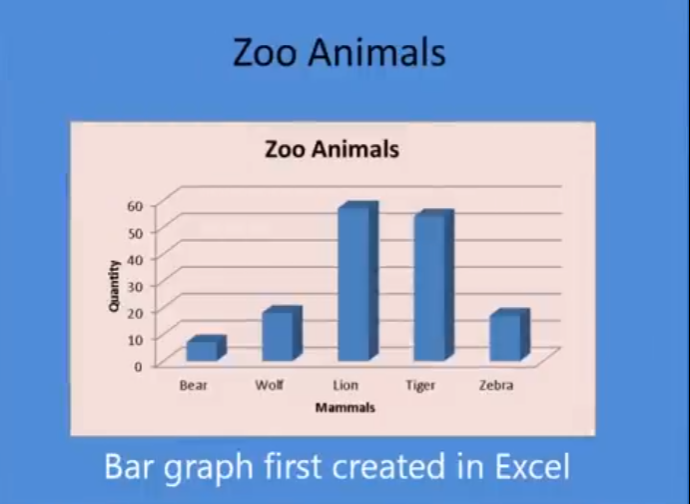
A blind student has demonstrated remarkable skills by completing complex Excel graphs and seamlessly integrating them into PowerPoint presentations. This achievement in Excel Graphs and PowerPoint Integration highlights the potential of assistive technologies and the importance of accessibility in education. He got an A on this project.
A blind student successfully completes sophisticated Excel graphs, showcasing their proficiency with assistive technology. They seamlessly insert these graphs into PowerPoint, showcasing their ability to integrate complex data into presentations. This demonstrates their proficiency with both Excel and PowerPoint, highlighting their technical skills. This process involves several steps:
Creating the Graph in Excel:
Data Entry: The student inputs data into Excel using keyboard commands and screen reader software like JAWS.
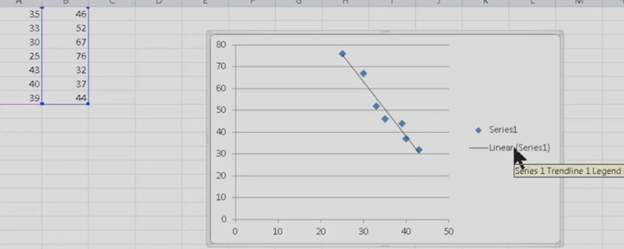
Graph Creation: Using commands such as Alt + N + S to insert a scatter plot and Alt + J + F to add a trendline, the student creates a detailed graph.
Customization: The graph is customized by adding titles, labels, and trendlines, ensuring all elements are accessible and correctly formatted.
Inserting the Graph into PowerPoint:
Copying the Graph: The student uses Ctrl + C to copy the graph from Excel.
Insert Graph: He has used the insert menu to insert graphs on the slides
Pasting into PowerPoint: Using Ctrl + V, the graph is pasted into a PowerPoint slide, where it can be further edited and formatted.
To create a line plot graph in Excel with keyboard commands, first select your data using Shift + Arrow keys. Next, press ALT + N, L to insert a line chart. After the chart appears, press CTRL + 1 to format it. Use ALT + J, T to add a chart title and ALT + J, A, I to add axis titles. This process efficiently creates a line plot graph while using only keyboard commands for input and formatting.
Here is a list of all the commands used in the lesson on how to create a graph and other charts:
Copy and Paste Data: This is fundamental in creating Excel line plot graphs.
Select columns A and B.
CTRL + C: Copy data.
CTRL + V: Paste data into Excel.
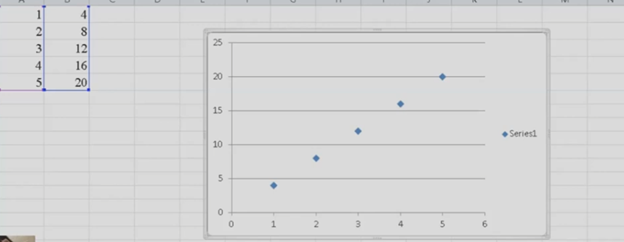
Insert an Excel Scatter Plot Graph: Often used before converting to a line plot graph.
ALT + N, D: Insert Scatter Plot (Insert tab and Scatter option).
Add Titles to the Graph: Important for any graph to be understood.
ALT + J, T: Adds a chart title. Type the title and press Enter.
ALT + J, A, I: Adds axis titles. Type the title for the X-axis or Y-axis and press Enter.
Chart Tools for Excel line plot graph
ALT + J: Open Chart Tools Layout tab.
T: Add a chart title.
Choose Above Chart (Arrow keys, Enter).
ALT + J, A, I: Add Axis Titles, essential for creating your graph.
Right Arrow: Select primary horizontal (for X-axis title).
W: Write the title (Enter title).
Repeat ALT + J, A, I for vertical axis title (Y-axis).
Down Arrow: Rotate title, then Enter and type title.
Remove Legend from Excel Line Plot graph to simplify the presentation.
ALT + J, A, L: Remove the Legend.
None: Select “None” to remove the legend.
Copy and Paste Graph to include in your documents.
To create a curved (smoothed) line graph in Excel using keyboard commands, start by selecting your data with Shift + Arrow keys. Then, press ALT + N, L to insert a line chart. Once the chart is selected, press CTRL + 1 to open the Format Data Series pane. Use Tab to navigate and enable the “Smoothed Line” option. You can add chart titles using ALT + J, T and axis titles with ALT + J, A, I. This sequence creates and formats a smoothed line graph efficiently.
Here are all the keyboard commands to create a curved line graph (smoothed line chart) in Excel:
Select Data:
Use Arrow keys to navigate and Shift + Arrow keys to select your data range or arrow into data and ctrl A to select all data.
Insert a Line Chart:
ALT + N, L: Opens the Insert tab and selects the Line Chart option.
Down Arrow to select “2D Line with Markers.”
Enter to insert the line chart.
Smooth the Line for curved line graph:
Select the chart with Arrow keys or Tab to highlight it.
CTRL + 1: Opens the Format Data Series pane.
Use Tab to navigate to the “Smoothed Line” checkbox, then Spacebar to enable it.
Add Chart Titles to curved line graph:
ALT + J, T: Adds a chart title. Type the title and press Enter.
ALT + J, A, I: Adds axis titles. Type the title for the X-axis or Y-axis and press Enter.
These commands will guide you through creating and formatting a smoothed line graph in Excel. Learn about more Creation of Graphs here.
Kaleigh, one of my (Dr Robinson) students since 2007, learned to Complete an excel graph in this lesson. She began with in-person lessons before transitioning to remote instruction. My husband and I moved 3,000 miles away to care for his parents, and we continued lessons via Skype, later advancing to Zoom. Over time, Kaleigh progressed from basic lessons to more sophisticated ones, covering her educational needs from third grade through graduation. By the time she finished, she was fully prepared for college and capable of completing all the work necessary to succeed in her future academic endeavors.
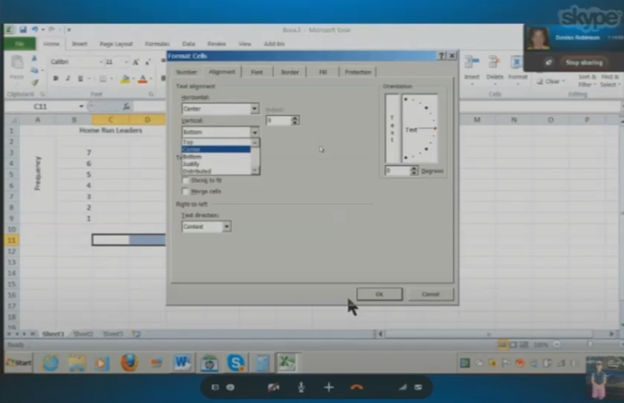
In this lesson, I teach her to navigate Excel using keyboard commands. She starts by creating a new document with CTRL + N and merges cells using ALT + H, M to set up graph labels. She inputs data from her Braille Display, with Excel’s talking software aiding her understanding. As she works on the histogram, she ensure she selects the correct cells and counts for the X and Y axes. She then adds and formats axis titles using ALT + J, A, I, adjusting the text orientation as needed.
Encouragement is Key
I consistently encourage her to check her data, ensuring she relies on assistive technology for accuracy. For formatting, she uses CTRL + C and CTRL + V to copy and paste sections, speeding up the process. We also cover coloring the graph, where I allow her to choose colors freely. I advise her to use consistent formats for simplicity. She shades sections of the histogram based on her data, using keyboard commands to control her workflow efficiently. This reinforces her independence and accuracy throughout the lesson.
Complete an excel graph Settings Option
After finishing the graph, she reviews her work using CTRL + Home to ensure all elements are correct. Satisfied, she copies the graph into Word and prepares to email it. This exercise demonstrates her effective use of keyboard shortcuts and assistive technology. Her growing independence in mastering Excel for academic tasks shows through her efficient and accurate work. The lesson highlights how the student combines guidance and technology to complete a detailed graph with confidence.
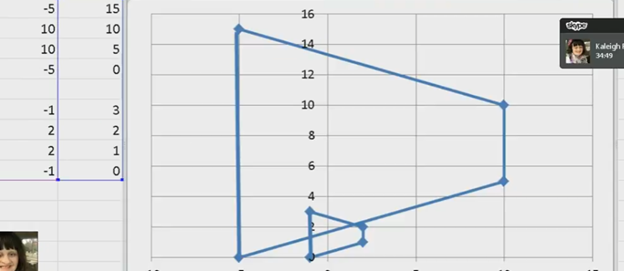
kaleigh takes images from a PDF and creates Geometry shapes such as vertices in Excel for perfect graphing.
In Excel, you can create vertices (edit points on a line) when working with shapes or lines. Here are the keyboard commands to manipulate vertices:
Always create a table with all pertinant numbers based on the math from your Work. Kaleigh took her work from a PDF and transported it into excel. If you make a space in excel leaving cells empty, you can create 2 intersecting graphs.
Basic Overview of Geometry using Excel Shapes
Insert a Shape:
Press ALT + N, SH to open the Shapes menu.
Use the arrow keys to select a line or shape and press Enter.
Edit Vertices:
Select the shape.
Press Shift + F10 (context menu) and choose “Edit Points” by using the arrow keys and pressing Enter.
Move Vertices:
Use arrow keys to move vertices around once in edit mode.
These steps allow for creating and editing vertices in Excel. More Excel lessons.
Remote Instruction via access Technology-Finish Real Work in Real Time
Empowering Blind & Visually Impaired Students Through Technology and Direct Instruction-Access Technology that Gives you Vision
Offering Personalized 1:1 remote instruction in technology, Braille, Nemeth, and essential blind skills — for students of all ages, anywhere in the world, enhances their educational access. These services ensure all can access educational opportunities effectively.
Founded in 2007 by Dr. Denise M. Robinson, a global leader in remote instruction for blind and low-vision education, TechVision brings together a nationally recognized team of blind education specialists, access technology experts, transcribers, and certified braille instructors. The team delivers expert training in access technology, braille, braille math code, screen readers, and comprehensive academic accessibility. Through real-time, individualized instruction, TechVision equips blind learners of all ages to participate equally, work independently, and succeed across educational and professional environments.
What We Do: Educational Access
We Provide:
Support for families, schools, transition programs, and vocational rehabilitation with the goal of improving access to education.
1:1 specialized instruction in technology, Braille, Nemeth, and all academic access through use of a computer.
Training for school teams — Teachers of the Blind & Visually Impaired, transcribers, paras, and School staff
Technology setup & independence training using screen readers, braille displays, and computers
The TechVision Difference
TechVision, LLC transforms lives through personalized, real‑time remote instruction. Our team equips blind and visually impaired students and clients with the technology skills they need to compete equally with their sighted peers — in school, work, and life. We collaborate with families, districts, and agencies worldwide to ensure every learner has educational access and independence.
Why Educational Access Matters
With cutting‑edge tools — computers, screen readers, braille displays, and smartphones — our students learn to access information, navigate their world, and build independence. TechVision empowers learners to step into education and employment with the same opportunities as their sighted peers.
Who We Serve
College students needing support for educational access
Young adults
Adults returning to work
Anyone needing access to their world
Real 1:1 TechVision Instruction
Students learning to create graphs, write documents, code, and navigate technology independently. Doing Everything their peers are doing.
Office 365 online is fully accessible with screen readers, enhancing the user experience for visually impaired users. Through straightforward keyboard shortcuts, users can navigate and manage their documents efficiently. The interface supports major screen readers like JAWS, NVDA, and VoiceOver, ensuring users can access emails, calendars, and all Office apps without a mouse. This integration empowers users to perform complex tasks seamlessly, from editing documents to collaborating in real time, ensuring a barrier-free environment for all users.
These shortcuts are integral for quick editing and formatting within Office 365 online access for applications, streamlining the process of document creation and modification.
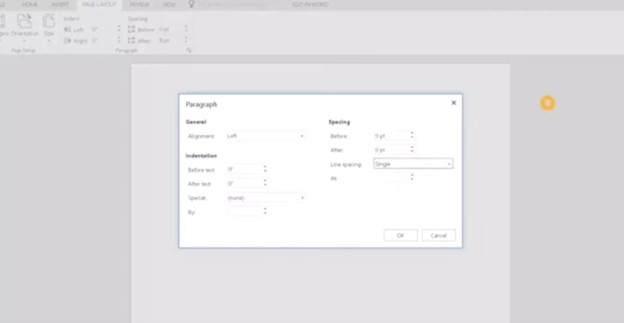
In Office 365 applications like Word, you can quickly apply or change text styles using the Styles pane. The shortcut to open the Styles pane is ALT + CTRL + Shift + S. This allows you to apply predefined styles to your text efficiently. Additionally, you can use CTRL + Shift + S to open the Apply Styles dialog box, where you can type and apply a style name directly to the selected text. These shortcuts help streamline formatting and ensure consistent document styling.
Other Online Office 365 online access commands
Here are some essential commands for using Office 365 online efficiently:
Save: Ctrl + S
Undo: Ctrl + Z
Redo: Ctrl + Y
Open: Ctrl + O
Print: Ctrl + P
Copy: Ctrl + C
Paste: Ctrl + V
Cut: Ctrl + X
Bold: Ctrl + B
Italic: Ctrl + I
Underline: Ctrl + U
Insert Hyperlink: Ctrl + K
Refresh the Document: F5
Find: Ctrl + F
Replace: Ctrl + H
These shortcuts are fundamental for navigating and managing documents in Office 365 online, making your workflow quicker and more efficient.
Here are more helpful tips for using Office 365 effectively:
Quick Access Toolbar Customization:
Customize your Quick Access Toolbar by adding frequently used commands. Right-click any command in the ribbon and select “Add to Quick Access Toolbar.”
Use “Tell Me” Feature:
Use the “Tell Me” feature (light bulb icon or ALT + Q) in the ribbon to quickly find features or help with commands you’re unsure about.
Keyboard Shortcut Customization:
Customize keyboard shortcuts through the Word Options dialog to tailor your workflow preferences.
Use Version History:
Use Version History to view and restore previous versions of your documents, especially useful in collaborative settings.
Collaborate in Real-Time:
Use the collaboration tools in Word, Excel, and PowerPoint to work with others in real-time, seeing changes as they happen.