Using Venn diagrams with screen readers involves strategic design and specific keyboard commands to ensure accessibility. Each set in the diagram must have clear, descriptive labels to guide screen reader users effectively. These labels help users understand the content without needing visual cues. Alt text plays a crucial role by summarizing the Venn diagram’s purpose, the sets involved, and their intersections. This concise description enables screen reader users to grasp the diagram’s structure and intent.
Keyboard navigation is essential for screen reader users to interact with Venn diagrams. The Tab key allows users to move through interactive elements like text boxes or linked descriptions associated with the diagram. Arrow keys are useful for navigating within tables or text boxes that describe the diagram’s content. This functionality ensures that users can access all relevant information without relying on visual input.
Screen Reader Venn Diagram Commands
Screen reader software, like JAWS or NVDA, includes commands that facilitate navigation. In JAWS, the Ctrl+H command lets users jump between headings, making it easier to navigate through complex content. NVDA users can use the Ctrl+Alt+Arrow keys to move between headings or landmarks within a webpage or document. These commands are vital for quickly accessing different parts of the content related to the Venn diagram.
Incorporating structured content enhances the usability of Venn diagrams for screen reader users. Headings, bullet points, and numbered lists help break down complex information into manageable sections. This structure allows users to follow the logical flow of information without confusion. So, Screen reader users can also navigate through tables that complement the Venn diagram. Tables list elements within each set and describe intersections, making the relationships between sets clear. JAWS users can move horizontally between cells using Ctrl+Alt+Right/Left Arrow keys, and vertically with Ctrl+Alt+Up/Down Arrow keys.
Careful Planning
Creating accessible Venn diagrams for screen reader users requires careful planning. By using descriptive text, alt text, structured content, and keyboard commands, educators and content creators can ensure that all users, including those who rely on screen readers, can effectively interact with and understand Venn diagrams. These strategies are essential for making complex visual information accessible to everyone. More Video Lessons here
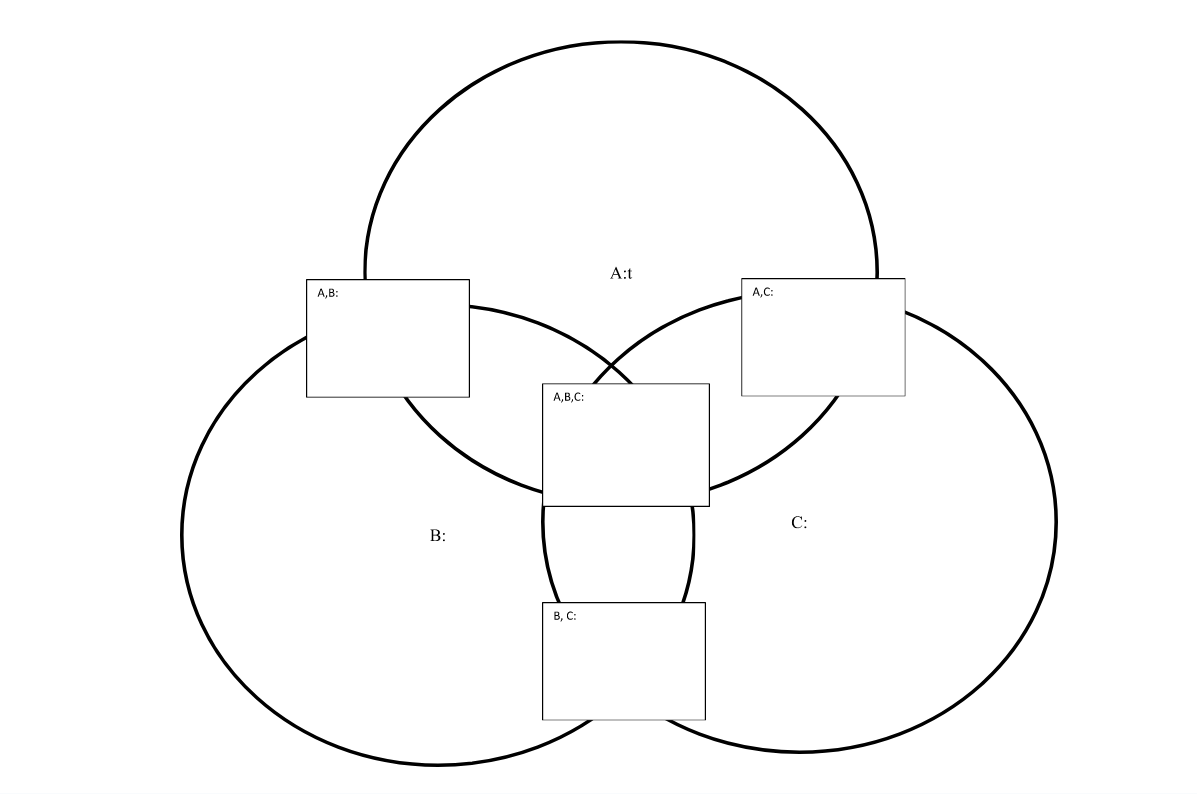
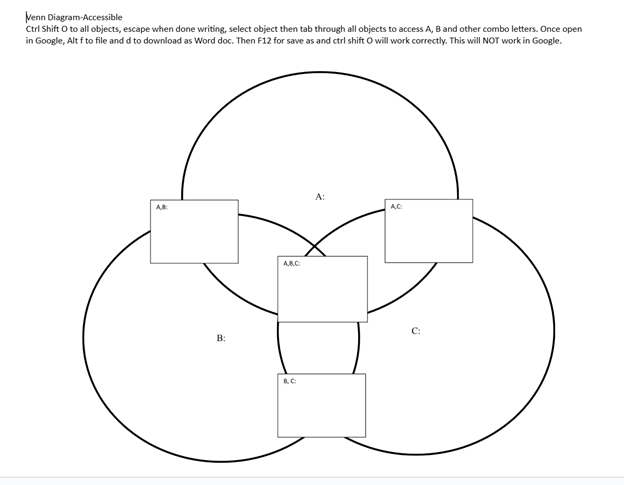
Create your Venn Diagram via WORD and shapes, applications key to move to back or forward then use these commands to access: Venn Diagram-Accessible
Ctrl Shift O to all objects, escape when done writing, select object then tab through all objects to access A, B and other combo letters. Once open in Google, Alt f to file and d to download as Word doc. Then F12 for save as and Ctrl Shift O will work correctly. This will NOT work in Google.
When done, have student emboss off a copy to feel what it is like and if you are having computer issues, tweak it to work better with screen reader.
Another lesson that occurs in school: Family Tree with Smart Art and screen reader
Math Lessons
Braille Math in WORD Editor-Multi-line
Desmos Lessons:
for STEM and Embossing in Desmos
Desmos and inserting graphs into Math Work in WORD
Creating shaded Parabolas in Desmos
Games with Desmos with Drag and Drop