Scatter plot graphs in excel have essential commands for graphs and Trendlines. Learn commands onlint and below.
EXCEL
Here is the complete list of steps with all relevant Excel commands for a Scatter Plot Graph.
- Insert a Scatter Graph:
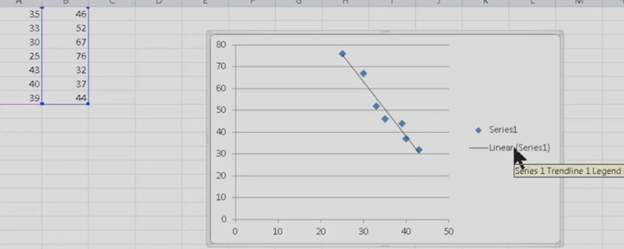
- Select the data in columns A and B (X and Y values).
- Insert a Scatter Graph from the Insert tab: ALT + N, D (for scatter).
- Add a Graph Trendline in Excel:
- After inserting the graph, press ALT + J to navigate to the Chart Tools Layout tab.
- Go to the Trendline option by pressing Down Arrow to Linear Trendline and press Enter.
- Change Series Label (Series 1):
- Press Right Arrow to move to Series 1 in the chart.
- Press the Applications key (also known as the context menu key) to open the menu.
- Select Data:
- From the context menu, Up Arrow to Select Data.
- Press Enter to open the Select Data Source dialog.
- Edit Data:
- Press ALT + E to open the edit data option.
- Use Tab to navigate and edit data as needed.
- Copy and Paste Graph:
- Copy the graph using CTRL + C.
- Paste the graph into another document using CTRL + V in the desired location.
These commands streamline the process of creating and customizing a graph in Excel.