Using Excel for geometry tasks, such as inserting shapes and labeling graphs, can be highly effective, especially for visually impaired students. By leveraging keyboard commands, students can efficiently navigate through Excel’s features. For instance, pressing Alt + N opens the Insert tab, and SH brings up the Shapes menu, allowing users to select and draw shapes. To label a graph, students can use Alt + JC to access the Chart Tools Design tab, followed by A to add chart elements like data labels and titles. These steps not only enhance the learning experience but also demonstrate the power of assistive technology in making complex tasks accessible and manageable
Start at the top of A1 and start adding data in both A and B. Make sure you add a space between you 2 Geometric shapes so they can mirror each other or whatever the assignment requires.
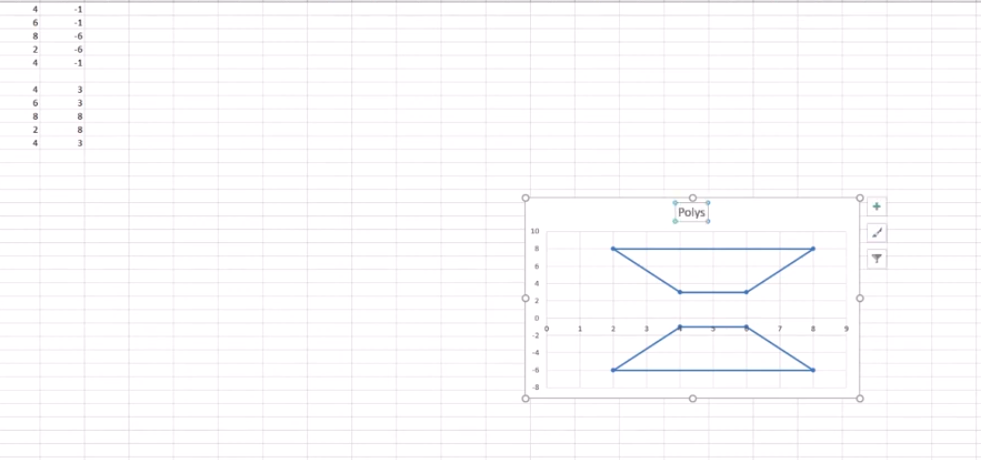
Here are other options for Geometry shapes
Here’s how you can insert shapes and label a graph in Excel using keyboard commands:
Excel for Geometry: Create Shapes and Label Graph
Inserting Shapes
- Open Excel and navigate to the worksheet where you want to insert shapes.
- Press
Altto activate the ribbon shortcuts. - Press
Nto go to the Insert tab. - Press
SHto open the Shapes menu. - Use the arrow keys to select the shape you want, then press
Enter. - Click and drag (or use arrow keys) to draw the shape on your worksheet.
Labeling a Graph
- Select your chart by pressing
Ctrl + Arrow keysto navigate to it. - Press
Altto activate the ribbon shortcuts. - Press
JCto go to the Chart Tools Design tab. - Press
Ato open the Add Chart Element menu. - Press
Dto select Data Labels, then choose the desired position using the arrow keys and pressEnter.
Adding a Chart Title to Excel for Geometry
- Select your chart.
- Press
Altto activate the ribbon shortcuts. - Press
JCto go to the Chart Tools Design tab. - Press
Ato open the Add Chart Element menu. - Press
Tto add a chart title, then type your title and pressEnter.
These steps should help you efficiently create Shapes and label graphs in Excel using keyboard commands. If you need more detailed instructions or have any specific questions, feel free to ask!
Other Excel Lessons
Another Student Mastering Excel with PPT integration
Excel line plot graph-copy to Word for Math
Complete an excel graph and copy into Word document with screen reader
If your fingers need to see multiple lines on your display, then this lesson will help