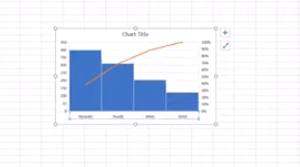
Creating a histogram in Excel using keyboard commands makes data analysis quick and efficient. First, select your data with Shift + Arrow Keys. Then, insert the chart using Alt + N, followed by H to choose a histogram. This process allows you to visualize data distributions without a mouse, making it both accessible and streamlined. By using these simple commands, you can create effective histograms in just a few steps.
To create a graph in Excel using keyboard commands:
- Select Data: Highlight the data using Shift + Arrow Keys.
- Insert Chart: Press Alt + N to open the Insert tab.
- Open Histogram Option: Press H to select the Histogram option from the Charts menu.
- Choose Histogram: Use Arrow Keys to navigate and press Enter to insert the histogram.
Now you have a histogram using just the keyboard.

When you finish, you can move data into DESMOS and emboss the graph
Excel Trendline with Scatter Plot
Other Excel Lessons that you can do in Sheets
Flashcard Study in Sheets
Increase your Technology knowledge via more lessons
