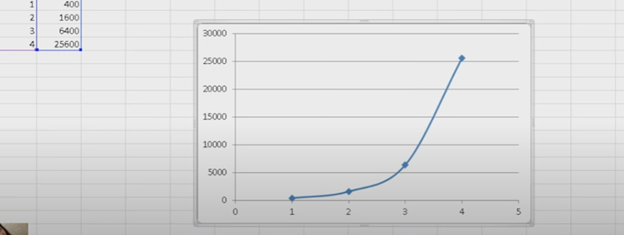
To create a curved (smoothed) line graph in Excel using keyboard commands, start by selecting your data with Shift + Arrow keys. Then, press ALT + N, L to insert a line chart. Once the chart is selected, press CTRL + 1 to open the Format Data Series pane. Use Tab to navigate and enable the “Smoothed Line” option. You can add chart titles using ALT + J, T and axis titles with ALT + J, A, I. This sequence creates and formats a smoothed line graph efficiently.
Here are all the keyboard commands to create a curved line graph (smoothed line chart) in Excel:
- Select Data:
- Use Arrow keys to navigate and Shift + Arrow keys to select your data range or arrow into data and ctrl A to select all data.
- Insert a Line Chart:
- ALT + N, L: Opens the Insert tab and selects the Line Chart option.
- Down Arrow to select “2D Line with Markers.”
- Enter to insert the line chart.
- Smooth the Line for curved line graph:
- Select the chart with Arrow keys or Tab to highlight it.
- CTRL + 1: Opens the Format Data Series pane.
- Use Tab to navigate to the “Smoothed Line” checkbox, then Spacebar to enable it.
- Add Chart Titles to curved line graph:
- ALT + J, T: Adds a chart title. Type the title and press Enter.
- ALT + J, A, I: Adds axis titles. Type the title for the X-axis or Y-axis and press Enter.
These commands will guide you through creating and formatting a smoothed line graph in Excel. Learn about more Creation of Graphs here.

YouTube Channel: and let us know how we can help you: Contact: TechVisionTraining@yourtechvision.com
