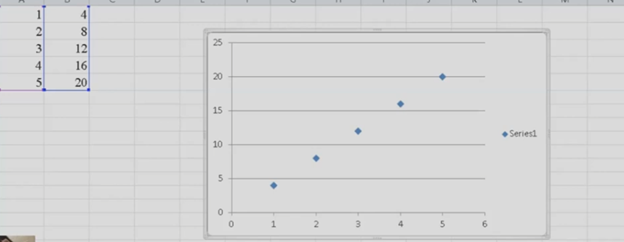
To create a line plot graph in Excel with keyboard commands, first select your data using Shift + Arrow keys. Next, press ALT + N, L to insert a line chart. After the chart appears, press CTRL + 1 to format it. Use ALT + J, T to add a chart title and ALT + J, A, I to add axis titles. This process efficiently creates a line plot graph while using only keyboard commands for input and formatting.
Here is a list of all the commands used in the lesson on how to create a graph and other charts:
- Copy and Paste Data: This is fundamental in creating Excel line plot graphs.
- Select columns A and B.
- CTRL + C: Copy data.
- CTRL + V: Paste data into Excel.
- Insert an Excel Scatter Plot Graph: Often used before converting to a line plot graph.
- ALT + N, D: Insert Scatter Plot (Insert tab and Scatter option).
- Add Titles to the Graph: Important for any graph to be understood.
- ALT + J, T: Adds a chart title. Type the title and press Enter.
- ALT + J, A, I: Adds axis titles. Type the title for the X-axis or Y-axis and press Enter.
Chart Tools for Excel line plot graph
- ALT + J: Open Chart Tools Layout tab.
- T: Add a chart title.
- Choose Above Chart (Arrow keys, Enter).
- ALT + J, A, I: Add Axis Titles, essential for creating your graph.
- Right Arrow: Select primary horizontal (for X-axis title).
- W: Write the title (Enter title).
- Repeat ALT + J, A, I for vertical axis title (Y-axis).
- Down Arrow: Rotate title, then Enter and type title.
- Remove Legend from Excel Line Plot graph to simplify the presentation.
- ALT + J, A, L: Remove the Legend.
- None: Select “None” to remove the legend.
- Copy and Paste Graph to include in your documents.
- CTRL + C: Copy the graph.
- CTRL + V: Paste the graph into Word Document
These commands make it easier to format any graph data and other chart types. More Excel Work and more math lessons of all sorts with keyboard commands

