Kaleigh, one of my (Dr Robinson) students since 2007, learned to Complete an excel graph in this lesson. She began with in-person lessons before transitioning to remote instruction. My husband and I moved 3,000 miles away to care for his parents, and we continued lessons via Skype, later advancing to Zoom. Over time, Kaleigh progressed from basic lessons to more sophisticated ones, covering her educational needs from third grade through graduation. By the time she finished, she was fully prepared for college and capable of completing all the work necessary to succeed in her future academic endeavors.
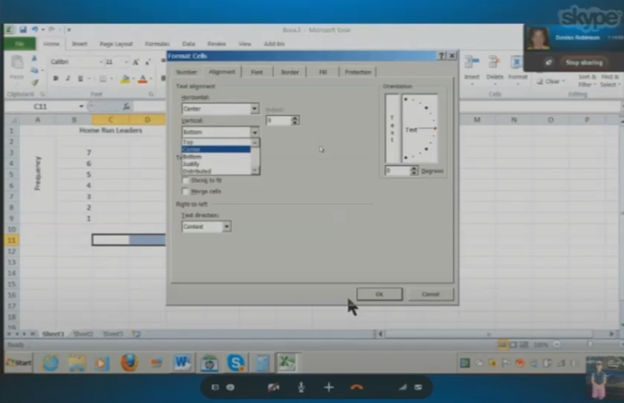
In this lesson, I teach her to navigate Excel using keyboard commands. She starts by creating a new document with CTRL + N and merges cells using ALT + H, M to set up graph labels. She inputs data from her Braille Display, with Excel’s talking software aiding her understanding. As she works on the histogram, she ensure she selects the correct cells and counts for the X and Y axes. She then adds and formats axis titles using ALT + J, A, I, adjusting the text orientation as needed.
Encouragement is Key
I consistently encourage her to check her data, ensuring she relies on assistive technology for accuracy. For formatting, she uses CTRL + C and CTRL + V to copy and paste sections, speeding up the process. We also cover coloring the graph, where I allow her to choose colors freely. I advise her to use consistent formats for simplicity. She shades sections of the histogram based on her data, using keyboard commands to control her workflow efficiently. This reinforces her independence and accuracy throughout the lesson.
After finishing the graph, she reviews her work using CTRL + Home to ensure all elements are correct. Satisfied, she copies the graph into Word and prepares to email it. This exercise demonstrates her effective use of keyboard shortcuts and assistive technology. Her growing independence in mastering Excel for academic tasks shows through her efficient and accurate work. The lesson highlights how the student combines guidance and technology to complete a detailed graph with confidence.
More Excel Lessons and more math lessons in general from YouTube