Dr. Robinson introduces a lesson on using Microsoft Excel to solve math work, specifically focusing on inequalities and graphs. She begins by guiding students on how to put Excel in focus to tackle various math problems in Excel. This helps students to optimize their math work in Excel effectively. Next, she instructs them to create a template using a number line. To insert symbols like less than or greater than signs, students use the Alt + N and then U commands to insert bullets or symbols.
For students with a numpad, Alt + 7 and Alt + 9 quickly insert a hollow or solid bullet, respectively. For those without a numpad, they can use the Insert + Symbols option. Students then align their number line by inserting a bullet in the middle, ensuring four dashes on each side for perfect centering when solving math work in Excel.
Math Work in Excel and More
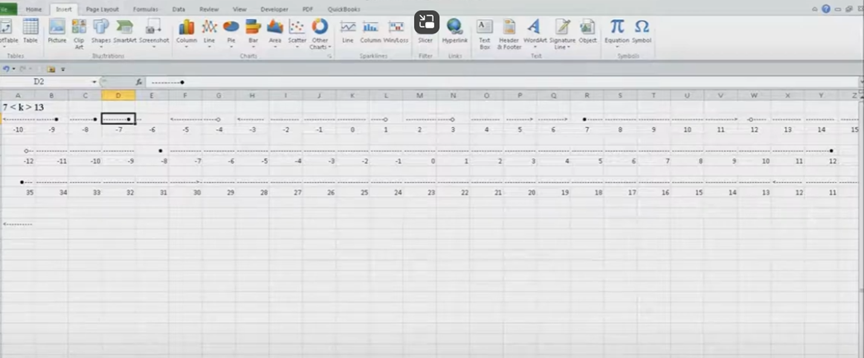
To center content, students use the Applications key and press F. They adjust the horizontal and vertical alignment to ensure everything is perfectly centered. This is a useful step when handling math problems in Excel. After completing their problems, students select the content using Shift + Right Arrow and copy it using Ctrl + C. This entire process enhances their skills in doing math work in Excel.
When pasting into Microsoft Word with Ctrl + V, students have various formatting options. By pressing the Control key and right arrow, they can select different formatting options for their pasted content. They can also Alt H to home and V to paste and right arrow through options. This flexibility allows blind students to format and customize their graphs just like their sighted peers when solving math problems in Excel. After the student pastes an image, they press the Applications key and up arrow to select Alt Text and type the description. Once they finish typing, they press Ctrl + Space and C to close the navigation pane and return to the document.
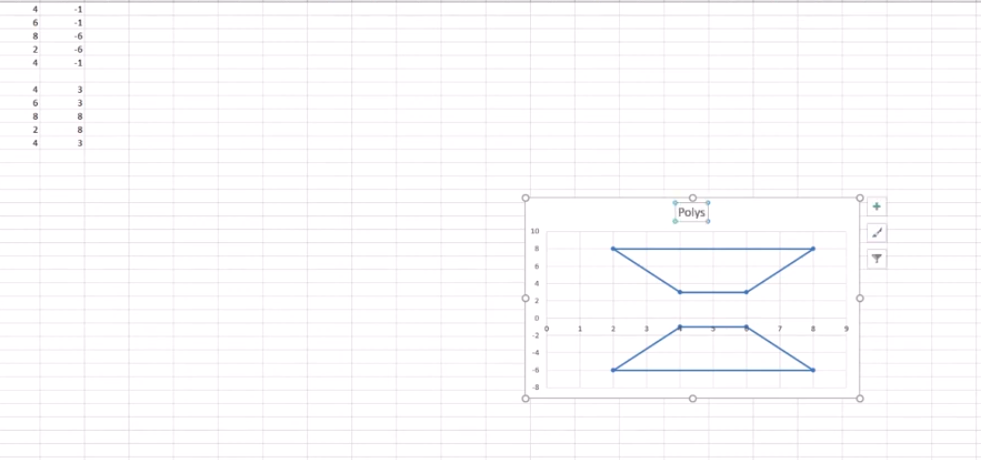
Dr. Robinson concludes by showing examples of completed math problems in Excel and graphs, demonstrating how well-formatted the number lines and inequalities look. Blind students can confidently create hollow and solid bullets, as well as inequalities, just like other students, thanks to the accessible features in Excel. This process ensures they stay engaged in their learning, achieving the same results as their peers when doing math work in Excel. Make sure your display is working well.
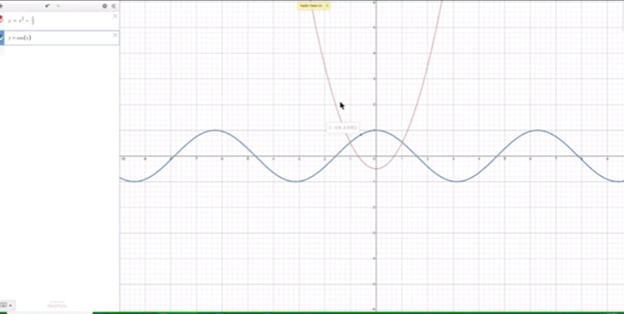
Curved line in Excel graph with screen reader
Excel Scatter Plot with Trendline
Excel Trend-line with Scatter Plot
